 |
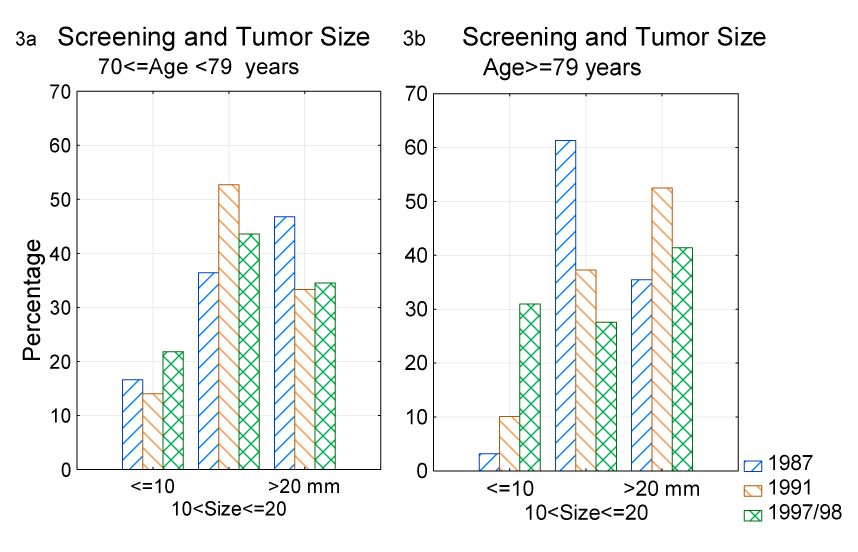
| Figure 3: A) Bars represent percentages for each sample in three tumor size interval. For tumors 10−20 mm, the 1991 sample differed significantly from controls (P<0,05). For tumors ≤ 10 mm the sample from 1997/98 was reduced to the control level. B) For small tumors (≤ 10 mm) the 1997/98 sample bar increased significantly (P<0.01) related to the controls. In tumors 10−20 mm, the control sample dominates and differs significantly from the1991 (P<0.05) and 1997/98 (P<0.01) samples. |