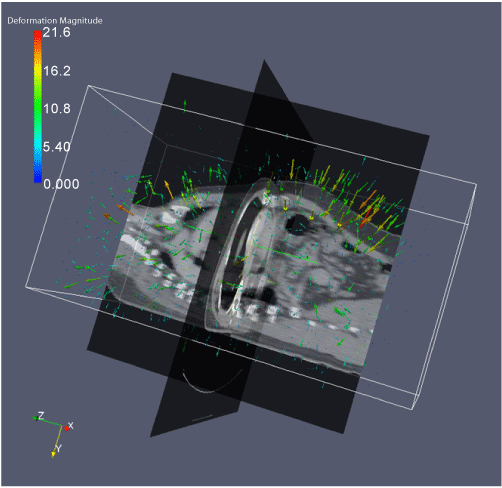
Figure 2: A 3D vector field shown in terms of color arrows
represents the deformation field generated from the deformable
image registration. The two orthogonal planar views represent
the fixed and moving volumetric CT image data, respectively.
The color scale legend indicates the displacement magnitude (in
mm) of the 3D deformation field.