 |
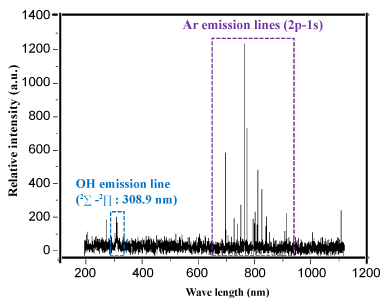
| Figure 6: Optical emission spectrum (OES) of the FE-DBD plasma jet. A typical OES collected from the FE-DBD plasma jet in an air condition at 8 kV power with spectral lines labeled according to their corresponding species. The y-axis represents the relative intensity in arbitrary units (a.u.), while x-axis represents the wavelength in nm. |