 |
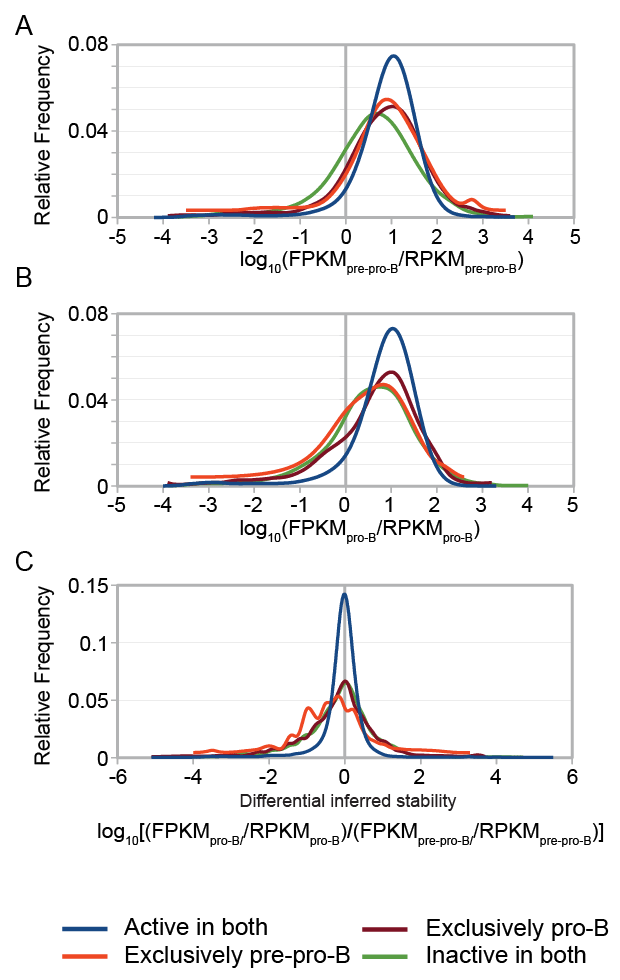
| Figure 6: Relationship between predicted promoter classes and FPKM/ RPKM ratio. (A and B) Graphs showing the relative frequency distribution of FPKM/RPKM ratios [log10(FPKM/RPKM)] for each predicted promoter class (see color key) in pre-pro-B cells (A) and pro- B cells (B). Plot displaying the differential ratio of log10[(FPKMpro-B/RPKMpro-B)/(FPKMpre-pro-B/RPKMpre-pro-B)] for each predicted promoter class (C). Frequency was assessed at increments of 0.1 of the calculated ratio and genes with zero value for either RPKM or FPKM were excluded from this analysis (A-C). All classes demonstrated statistically significant differences, with the exception of ‘exclusively pre-pro-B’ and ‘active in both’ in pre-pro-B cells (WMW p < 0.0001). |