 |
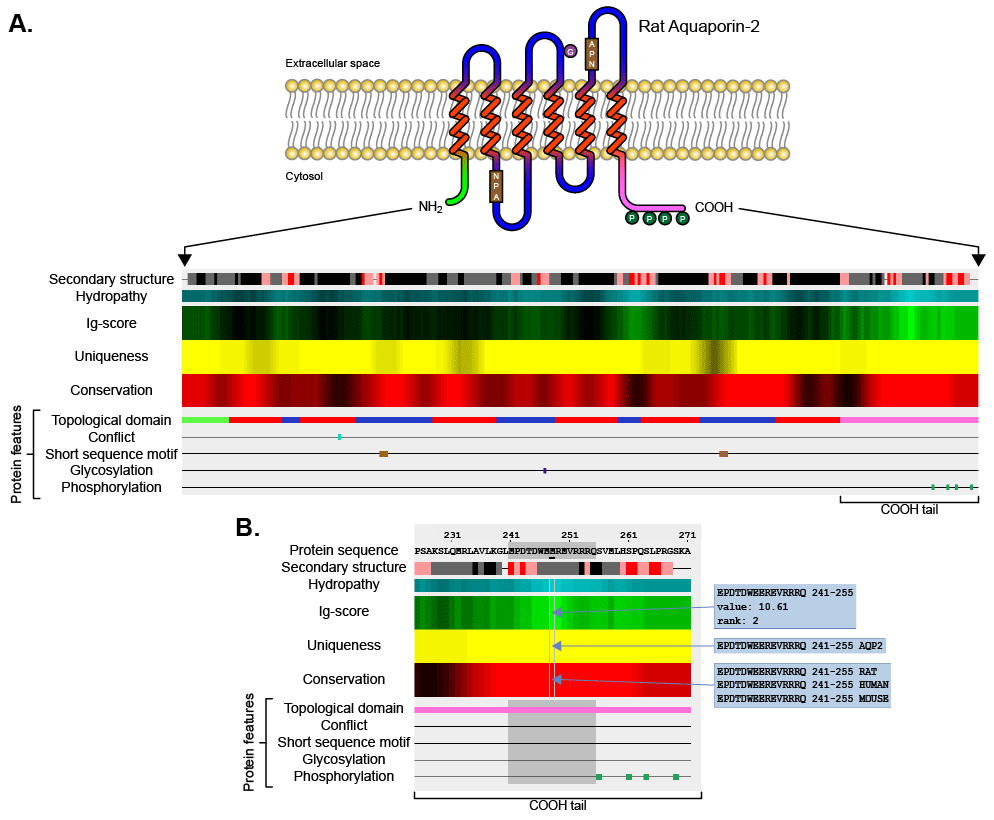
| Figure 1: AbDesigner output. A) AbDesigner analyzes the amino acid sequence of a protein of interest (apical membrane water channel, aquaporin-2 of rat with six membrane-spanning regions depicted in this example) and illustrates the immunogenicity score (Ig-score, in a green heat map), which is aligned with the calculated uniqueness score (in a yellow heat map), the calculated conservation score (in a red heat map), and protein features extracted from the corresponding Swiss-Prot record. By default, the highest Ig-score, uniqueness score, and conservation score are displayed in the brightest green, yellow, and red, respectively. The Kyte-Doolittle hydropathy index is shown in a cyan heat map (most hydrophilic displayed in the brightest cyan) and the Chou-Fasman secondary structure prediction is displayed by various colors (top row: alpha helix = gray, beta sheet = black, strong beta turn = red, or weak beta turn = pink). B) A magnified view of the carboxyl-terminal region of the graphical output of aquaporin-2 in A. When a peptide is selected by a mouse click, its sequence, scores, and features will be highlighted in gray. Further details for each element of the output can be viewed by mouse-over including the Ig-score value and rank as well as the multiple sequence alignments for representing the uniqueness and conservation. |