 |
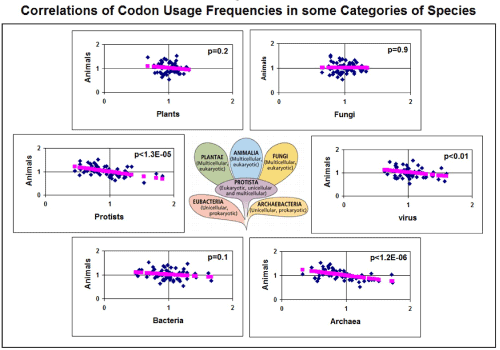
| Figure 3: Correlation of Codon Usage Frequencies in some Categories of Species. The relative CUF values were calculated for the 64 codons from the data in Figure 1 and plotted against each other (blue symbols). Red symbols indicate the linear regression lines. |