Analysis of Clodinafop-propargyl Herbicide Transport in Soil Profile under Vetiver Cultivation using HYDRUS-1D and Modified PRZM-3 Models
Received: 15-Oct-2016 / Accepted Date: 08-Jan-2017 / Published Date: 13-Jan-2017 DOI: 10.4172/2476-2067.1000120
Abstract
Chemicals such as herbicides used in agriculture, can be a source of soil and ground water pollution. Computer simulation models provide an efficient and cost-effective alternative that can be easily adapted to many field situations with varying soil types and different land uses. In the present study HYDRUS-1D and modified PRZM-3 (Pesticide Root Zoone Model) models were used to simulate clodinafop-propargyl (Topik) herbicide in soil profile and plant uptake under vetiver cultivation The measured data were obtained from treatments with two concentrations of the herbicide applied to the vetiver grass (C1V and C2V) and without vetiver grass (C1S and C2S). The vetiver grass uptake of clodinafop-propargyl was 1198.8 and 1107.4 mg.ha-1. The observed data showed that in surface layer, 0-10 cm, clodinafop-propargyl concentration was increased because of volatilization of herbicide from the deeper soil layer to soil surface, upward flow of water in soil and cracks in soil surface. The measured data for C2V treatment was used for calibration and the measured data from the other treatments were used for validation of above models. The statistical parameters showed that modified PRZM-3 model was more accurate than HYDRUS-1D for predicted of herbicide concentration in soil and vetiver uptake. The error of HYDRUS-1D model was about 2.5 times higher than the modified PRZM-3 model. The predicted cumulative uptake of clodinafoppropargyl by vetiver grass through modified PRZM-3 model was about 1.5 times higher than that predicted by HYDRUS-1D model. In general, plant uptake of herbicide estimated by HYDRUS-1D model was more accurate than modified PRZM-3 model.
Keywords: Herbicide; Modeling; Phytoremediation; Soil pollution; Vetiver
Introduction
Herbicides include a specific group of chemical compounds that play an important role in agriculture and public health [1]. In most countries, the use of herbicides to remove weeds is one of the most important ways to manage weeds. Despite many benefits such as controlling pests and increasing yield, herbicide residues in soil can pollute water resources, soil and in crop rotations it causes damage to sensitive plants [2].
Phytoremediation refers to the technologies in which living plants are used to clean up soil, air, and water contaminated with hazardous chemicals [3]. Phytoremediation is a cost-effective plant-based approach of remediation that takes advantage of the ability of plants to concentrate elements and compounds from the environment and to metabolize various molecules in their tissues. It refers to the natural ability of certain plants called hyperaccumulators to bioaccumulate, degrade, or render harmless contaminants in soils, water, or air. Toxic heavy metals and organic pollutants are the major targets for phytoremediation [4]. Phytoremediation is interested because of low energy consumption and environmental compatibility [5]. The plant species that is used for phytoremediation should have high tolerance to toxins and pollutants.
Chrysopogon zizanioides, commonly known as vetiver is a perennial bunchgrass of the Poaceae family. Vetiver is most closely related to sorghum but shares many morphological characteristics with other fragrant grasses, such as lemongrass (Cymbopogon citratus), citronella (Cymbopogon nardus, C. winterianus), and palmarosa (Cymbopogon martinii). Vetiver grass is known principally for soil and water conservation. Its deep root system enables it to tolerate extreme climatic conditions including prolonged droughts, flooding, fires and frost. Vetiver grass is grown for many different purposes. The plant helps to stabilise soil and protects it against erosion, but it can also protect fields against pests and weeds. The vetiver grass has extraordinary properties in soil and water conservation. The morphological, physiological and unique traits of vetiver grass can be used for prevention and treatment of chemical pollution in soil. Therefore, use of vetiver grass on a large scale as a purification plant was introduced [6]. Most of the roots in vetiver’s massive root system are very fine, with average diameter 0.5-1.0 mm. This provides an enormous volume of rhizosphere for bacterial and fungal growth, which is required to absorb contaminants for break down processes [7].
The clodinafop-propargyl is a systemic herbicide from aryloxyphenoxy propionic acid groups that is recommended to combat narrow-leaf weeds in wheat fields. The molecular formula for this herbicide is C17H13CIFNO4 (Figure 1). One or two hours after spraying clodinafop-propargyl, this herbicide is absorbed through the weeds leaf and weed growth is stopped after 48 h. The impact of herbicide on weeds that are sensitive to this herbicide will appear after one to three weeks.

Figure 1: Molecular structure of clodinafop-propargyl.
In different countries such as Iran, herbicides have been widely used for weed control. Increasing of yield in agriculture heavily depends on herbicides [8]. Clodinafop-propargyl herbicide is among widely applied herbicides for grass weed control in wheat fields of Iran [9]. The excessive use of herbicide leads to herbicide accumulation in soils.
This accumulation and its leaching is a source of agricultural pollution [10,11]. Leached herbicides could exert eco-toxicity effects even at low concentrations [12]. Therefore, herbicide pollution control in soil is necessary. Measuring the concentration of herbicides in soil and groundwater is too expensive, so the researchers followed suitable methods to predict them. Using simulation techniques are effective ways in terms of time and cost for a preliminary assessment of soil and groundwater pollution, assisting in the land use planning, resource management and monitoring programs. For this purpose, various simulation models such as Internet Geographical Exposure Modeling System (IGEMS), CHEMFLO, 2DFATMIC, 3DFATMIC, MULTIMDP (MULTIMED Daughter Process), HYDRUS-1D and PRZM-3, have been developed that two of the most frequently used are HYDRUS-1D and PRZM-3.
Gupta et al. [13] studied the persistence and mobility of 2,4-D in unsaturated soil zone under real field conditions for the wheat crop with different irrigation treatments. They measured 2,4-D residues in soil by sampling and then transport of herbicide into the soil were simulated using HYDRUS-1D model. The measured and simulated values had good correlation. They also reported that 2, 4-D soil residues depend on irrigation method and with proper irrigation it can be kept at an optimal level to avoided soil pollution.
Kodešová et al. [14] studied the impact of soil micromorphology on soil hydraulic properties, water flow and herbicide transport in the field with three soil types. They used HYDRUS-1D model to simulate solute transport. As a result of complex interactions between meteorological conditions and the soil pore structure, the single and dual-porosity models describe the herbicide behavior in soil with high clay content and high cation exchange capacity, while the dualpermeability model performs better in simulating the herbicide transport in soil with high organic matter.
Noshadi et al. [15] were used PRZM-3 and LEACHM models to simulate the residual concentration of 2, 4-D in silty clay soil under maize cultivation. The result showed that both models provided satisfactory prediction but PRZM-3 was more suitable than HYDRUS-1D model.
Noshadi et al. [15] modified PRZM-3 model. They solved water movement in soil equation (Richard’s equation) with numerically method of MC-Cormack. They indicated that simulation of 2, 4-D transport in soil profile with modified PRZM-3 model was better than unmodified PRZM-3 model.
Clodinafop-propargyl herbicide is widely applied in wheat fields of Iran. The area of wheat cultivation in Iran is approximately 6.6 million hectares, within several different regions that experience arid (34.0%), semi-arid (45.8%), mediterranean/semi-humid (15.2%), and humid (5.0%) climates [16]. Clodinafop-propargyl causes hepatocellular hypertrophy, necrosis of the liver and thymic atrophy at the highest dose level (EPA, 2003) [17]. The Agency’s Cancer Assessment Review Committee (CARC) classified clodinafop-propargyl as “likely to be carcinogenic to humans” (EPA, 2004) [18]. There is little information about phytoremediation and residue of clodinafop-propargyl herbicides in soil. To date, no attempt has been made to model this herbicide fate in soil profile and its remediation with vetiver grass. Therefore, determining the clodinafop-propargyl herbicide residues in soil profile and impact of vetiver grass in reducing soil contamination is very important. The calibrated and validated models such as HYDRUS-1D and PRZM-3 for prediction of clodinafop-propargyl herbicide fate in soil and its phytoremediation is necessary. The purpose of this research is calibration and validation of modified PRZM-3 and HYDRUS-1D models to predict concentration of clodinafop-propargyl in soil profile and plant uptake under vetiver grass cultivation and the suitability of the models were investigated.
Simulation Models
The HYDRUS-1D model is an unsaturated soil zone numerical model for analysis of water flow and solute transport [19]. The unsaturated soil hydraulic properties can be described using van Genuchten [20], Brooks and Corey [21], modified van Genuchten (Vogel and Císlerová, [22]), Durner [23], and Kosugi [24] type analytical functions. This model incorporates hysteresis and allow consideration of both equilibrium and nonequilibrium flow. The governing equations for nonequilibrium flow pertain to dual-porosity or dual-permeability flow regimes, in which a fraction of the liquid phase is assumed to be mobile (moving relatively rapidly) and another fraction is assumed to be immobile (moving relatively slowly or not at all) Simunek et al. [25].
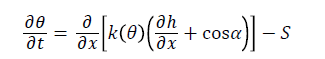
The program numerically solves both the Richards’ equation for unsaturated water flow and the Fickian-based advection–dispersion equation for solute transport Gupta et al. [13]. In HYDRUS-1D, onedimensional movement of water in soil described by numerical solution of Richard`s equation:
 (1)
(1)
Where θ is volumetric soil water content (L3L-3), t is time (T), k is the unsaturated soil hydraulic conductivity (LT-1), h is water pressure head (L), α is angle between the flow direction and the vertical axis (for vertical movement of water in soil α=0, for horizontal movement α=90 and 0<α<90 is for other direction.), S is the roots water uptake term (L3L-3T-1) and x is spatial coordinate (L) (positive upward).
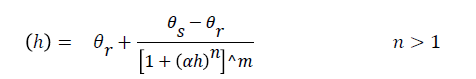
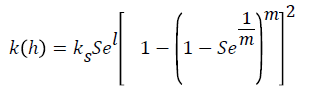
In this model, various relationships are defined for description of soil hydraulic properties such as water retention curve and unsaturated hydraulic conductivity. The most common relationship is the Van Genuchten - Mualem as follows Van Genuchten [20].
 (2)
(2)
 (3)
(3)
Where θr and θs is the residual and saturated water content (L3L-3), ks is the saturated hydraulic conductivity (LT-1), Se is relative saturation term, l is the pore connectivity parameter, α is reciprocal of the air entry pressure (L-1), n is related to the slope of the retention curve at the inflection point and m = 1−1/n.
The flow and solute equations incorporate a sink term to account for water uptake by roots. Water and salinity stresses were defined according to the functions proposed by Feddes et al. [26] and the Maas [27] salinity threshold and slope function, respectively. Soil evaporation and plant transpiration rates were obtained by combining the daily values of reference evapotranspiration (ETo), determined with the FAO Penman-Monteith method and the dual crop coefficient approach Allen et al. [28]. Nutrient uptake was simulated by considering unlimited passive uptake for nitrogen species Šimůnek and Hopmans [29].
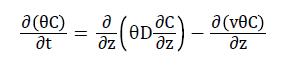
For solute transport, HYDRUS-1D model considers advective dispersive transport in the liquid phase as well as diffusion in the gaseous phase. Convective transport involves the passive movement of dissolved constituents with flowing water. Dispersive transport is a result of differential water flow velocities at the pore scale. Displacement of solutes is generally described by the convectiondispersion equation. For one-dimensional vertical transfer in a variably saturated medium where neither adsorption nor degradation occurs, it is expressed as follows:
 (5)
(5)
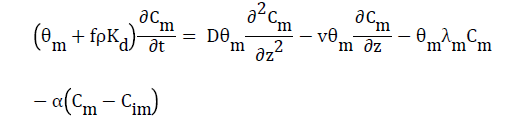
Where θ is the volumetric water content, C is the solute concentration, t is time, D is the hydrodynamic dispersion coefficient, z is the positive depth measured downward, and v is the average pore water velocity. For a two-region and dual-porosity type solute transport, Eq. (5) becomes
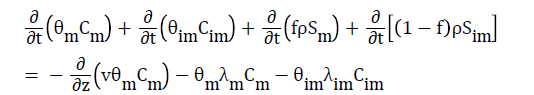 (6)
(6)
Where the subscripts “m” and “im” refer to mobile and immobile regions, respectively; f=θm θ-1 is equivalent to the fraction of adsorption sites in contact with the mobile liquid; ρ is the soil bulk density; S is the sink term in the flow equation (adsorbed concentration); λ is the first-order degradation constant; and v is the average pore water velocity in the mobile region:
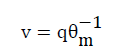 (7)
(7)
Where q is the water flux. Introducing linear adsorption and assuming uniform water flow in homogenous soil leads to the following equations:
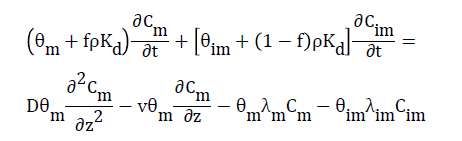 (8)
(8)
Where Kd is the distribution coefficient or first-order entrainment (detachment) coefficient. Diffusion transfer of solutes between the two water regions is modeled as a first-order process. First-order degradation is assumed to take place in the immobile region:
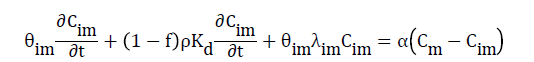 (9)
(9)
Where α is the mass transfer coefficient. Combining Eqs. (8) and (9) yields
 (10)
(10)
This equation describes the solute transport in a two-region flow system considering adsorption and degradation in both mobile and immobile regions Ladu et al. [30].
PRZM3 model links two subordinate models, PRZM and VADOFT, in order to predict pesticide transport and transformation down through the crop root and unsaturated zone. PRZM3 is a specific model for simulating pesticides as it is capable of simulating transport and transformation of the parent compound and as many as two daughter species. PRZM3 model has two major deficiencies. First, PRZM does not solve Richard's equation for simulating water movement in soil profile, but uses simple drainage rules to move water through the soil profile and due to the significant role of moisture in pesticide transport. This simplification leads to both inaccuracies in the final intended pesticide simulation results and increase in water balance error. Secondly, the major problem with the interfacing of these two models is that while VADOFT solves the Richards' equation for water flow in a variably saturated medium, PRZM uses simple drainage rules to move water through the soil profile. Because of this incompatibility, there may be times when PRZM produces too much water for VADOFT to accommodate within one day. The result of this would be water ponded at the interface, which is belong neither to PRZM or VADOFT. This is very likely to happen in agricultural soils, where subsoils are typically of lower permeability than those of the root zone, which have been tilled and perforated by plant roots and soil biota. Therefore, Noshadi and Jamshidi [31] modified this model and eliminated simplifications assumed in the original code of PRZM3 regarding unsaturated flow equation (RE) and water movement equations and resolved the equations with an accurate numerical solution using MC-Cormack method which is numerically stable and avoids mass-balance errors. In addition, the soil water was divided the soil water into mobile and immobile domains (MIM).
Materials and Method
This research was conducted in soil columns in the college of agriculture, Shiraz University, Shiraz, Iran. The experimental design was a randomized complete block. Fifteen soil columns were constructed from PVC pipes with a height of 120 cm and diameter of 40 cm. The soil columns were filled with field soil collected from the depths of 0-30, 30-60, 60-90, 90-120 cm, separately. They were collected and packed separately to simulate real field conditions. Some physical characteristics of soil are shown in Table 1. At three depths of 30, 60 and 90 cm, output valves were installed in the soil columns and a half-pipe with a diameter of 50 millimeters was filled with gravel and connected to the outlet valves with an inclined slope to exit drainage water easily (Figure 2). At the bottom of each soil column, metal mesh was placed to allow drainage water exit as free drainage condition.
| Soil depth (cm) | OM (%) | K (cmd-1) | FC (cm3cm-3) | PWP (cm3cm-3) | ρb (g cm-3) | Soil texture |
|---|---|---|---|---|---|---|
| 0-30 | 1.57 | 16.47 | 0.27 | 0.12 | 1.23 | Silty clay loam |
| 30-60 | 1.07 | 10.83 | 0.31 | 0.16 | 1.46 | Silty loam |
| 60-90 | 0.915 | 10.83 | 0.31 | 0.16 | 1.46 | Silty loam |
| 90-120 | 0.682 | 10.83 | 0.31 | 0.16 | 1.46 | Silty loam |
Table 1: Soil physical characteristics

Figure 2: The vertical cross section of soil column
In soil, organic matter was measured by wet oxidation method. Soil hydraulic conductivity was measured by inverse whole method for each soil depth, separately.
The TDR probes were placed at soil depths of 15, 45, 60 cm to measure the soil water content. Irrigation was scheduled based on the soil water deficit according to field capacity. The total irrigation water depth at the end of the growing season was 490 mm.
Vetiver (Chrysopogon zizanioides L. ) grasses were obtained from Agricultural Ministry of Iran. At first, the vetiver grasses were transplanted to the pots in green house to adapt to the new conditions for 2 weeks. Then, all vetiver grass shoots were cut to have identical heights of 30 cm and 3 vetiver grasses were planted in each soil column. Finally, one of them was kept which was more suitable in each soil column.
After transplanting vetiver grasses, all the shoots were cut to have identical heights of 30 cm and then planted in 9 soil columns on July 11th. After one week, and settlement of plants, the treatments of clodinafop-propargyl were applied to the soil with three replications.
Potential evapotranspiration was calculated using the Penman- Monteith FAO Allen et al. [28], using meteorological station in College of Agriculture. There is no crop coefficient (Kc) available for vetiver grass. The vetiver grass and sudan grass are similar to each other, and both of them are from the Gramineae family with high root depth (about 3 meters) Darajeh et al. [32]. Therefore, in this study, sudan grass crop coefficient (Kc) was used for vetiver grass.
To investigate the dissipation of clodinafop-propargyl in vetiver and soil, this herbicide was dissolved in water and sprayed on the soil’s surface. The recommended dose of clodinafop-propargyl is 0.8 L ha-1 (EC 8%) or 130.1 mg kg-1 Armin et al. [33]. The applied herbicide concentrations were 0.0 (C0), 484.6 (C1) and 969.2 (C2) mg kg-1 which concentrations of C1 and C2 were much higher than the recommended rate of application to investigate the phytoremediation ability of vetiver grass in very high herbicide concentrations. The aim of this research was measuring and simulating the soil residue and potential contamination of this herbicide in high concentrations.
The vetiver grasses were harvested at 128 days after herbicide application, and soil samples were collected from different depths, in 41, 62, 83, 104 and 128 days after herbicide application. For each treatment of vetiver crop (CV), a treatment with no plant (CS) was designated as a control in order to monitor the herbicide concentrations throughout the soil profile without plant. Additionally, treatment with three replications was considered, in which no herbicide was added to the soil and crop (C0V) to investigate the yield of vetiver grass in normal condition. The treatments list is shown in Table 2.
| Treatment | Clodinafop-propargyl concentration mg.kg-1 | Description |
|---|---|---|
| C1V | 484.6 | With vetiver and herbicide in C1 concentration |
| C2V | 969.2 | With vetiver and herbicide in C2 concentration |
| C1S | 484.6 | No vetiver with herbicide in C1 concentration |
| C2S | 969.2 | No vetiver with herbicide in C2 concentration |
| C0V | - | With vetiver and no herbicides |
Table 2: Description of different treatments
At 41, 62, 83 and 104 days after herbicide application, soil samples were taken from depths of 0 to 70 cm at 10 cm increments. Since the herbicide might have been diffused to the deeper depths of the soil profile, at the last sampling, 128 days after application, soil samples were taken from 0 to 120 cm of soil profile. The soil and vetiver samples were kept in -20°C for about 2 weeks until they were moved to the laboratory for herbicide’s residual concentration analysis.
Soil extraction
Sieved and air-dried soil samples (10 g) and 10 mL twice distilled water were mixed and was shaken for 5 minutes. A volume of 6 mL acetonitrile was added to the samples and then shaked for 45 minutes. Then 0.75 g of NaCl salt and 3g of MgSO4 was added to the samples and shaked for 1 minute. The samples were then centrifuged at 1500 rpm for 10 minutes to form a three-layer separation. Then 3 mL of the supernatant layer were removed and transferred to another tube and 75 mg PSA salt and 360 g MgSO4 was added. Then the samples were shaked for 1 minute and centrifuged for 10 minutes. They were then passed through the 45 micrometers filter and injected into the Agilent 7890AGC-MS [34].
In GC-MS for clodinafop-propargyl measurement, injection volume, inlet temperature, carrier gas and flow rate, were 1 mL, 250°C, helium and 1.2 ml.min-1, respectively. The column was MS-5975C Agilent, 30 m* 250 μm. The temperature programming is shown in Table 3.
| Ramp | Temperature gradient | Final temperature * |
|---|---|---|
| 1 | 10°C min-1 | To 130°C |
| 2 | 4°C min-1 | To 230°C |
| 3 | 10°C min-1 | To 290°C |
Table 3: Temperature programming in GC-MS for clodinafop propargyl measurement. *Contact time for the final temperatures was six minutes.
The stock solution of clodinafop-propargyl containing 1000 mg.L-1 was obtained from agricultural ministry of Iran. From this stock solution, 20, 10, 5, 2.5, 1.0, 0.5 and 0.1 mg.L-1 were prepared by serial dilution. Each solution with three replications was injected into GCMS and calibration curve was obtained.
Vetiver extraction
On November 15th, 128 days after application, the vetiver grass was removed from the soil and both roots and shoots were separated, weighted and air-dried in the laboratory. Washed vetiver plant samples were cut into small pieces and were frozen at -20°C until laboratory analysis. The frozen vetiver and soil samples at -20°C causes nonsignificant and long-term changes in microbial abundance and activity. It will also reduce the vapor pressure gradient. Therefore, at -20°C the herbicide concentration will be kept constant until analysis Zelles et al. [35]; Pesaro et al. [36].
The chopped plant sample (10 g) was taken in beakers. After 1 hour, the plant material was crushed and mortar with acetone (20 ml). The contents were filtered through filter paper. The extraction was repeated twice with 10 ml acetone each time. Then it was transferred to rotary evaporator and residue was dissolved in acetone and aqueous phases were then centrifuged to remove non-dissolved material. Then to measure the value of herbicide absorbed by the roots and shoots, samples were injected into the HPLC system. The column of HPLC was C-18 with 25 m length and carrier phases were water and acetonitrile at a ratio of 4 to 6. Flow rate and wavelength were 0.7 ml.min-1 and 305 nm, respectively.
Model validation
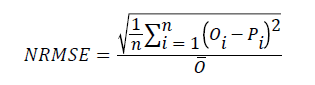
In this study, concentration distribution of clodinafop-propargyl in soil profile was simulated by HYDRUS-1D and modified PRZM-3 models. For evaluation of simulation precision some statistical parameters including NRMSE, d, CRM and Error were used Loague and Green [37]. NRMSE (normal root mean square error) provides the total difference between the measured and simulated data proportioned against means of measured data values. The lower limit for NRMSE is zero, which occurs when there is no difference between such paired data. Obviously, a small value of NRMSE indicates more accurate simulation.
 (1)
(1)
Where n is the number of observations, is measured values, is predicted values and is mean of measured values.
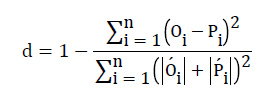
The index of agreement, d, was calculated for assessing the accuracy of simulated data. The maximum value for (d) is one, which occurs when simulated values are completely identical to the measured values.
 (2)
(2)
Where  and
and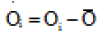
CRM (coefficient of residual mass) shows trends of model estimation towards more or less. A positive value indicates that the model is underestimated and negative value means the model is overestimated. For the best fit between the simulated and measured values, CRM value should be zero.
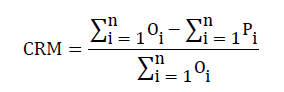 (3)
(3)
Error percentage is defined as a percentage of the difference between an approximate or simulated value and an exact or measured value. A lower value for error percentage means that the simulation result is closer to the measured values.
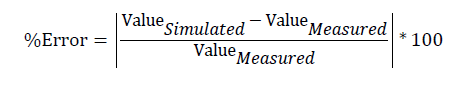 (4)
(4)
Results and Discussion
Measured data
Clodinafop-propargyl concentration in soil profile at different days after herbicide application for different treatments is shown in Figure 3. It illustrates that the herbicide diffused downwards to 90 cm of soil. In general, results demonstrated that in soil profile at last sampling date, 128 days after herbicide application, the concentrations of clodinafop-propargyl in C1V and C2V treatments were 17.0% and 25.8% lower than C1S and C2S treatments, respectively.
In C1V treatment at 40, 62, 83, 104 and 128 days after herbicide application, the concentration of clodinafop-propargyl in 0-10 cm soil depth was 0.98, 0.31, 0.230, 0.384 and 0.215 mg.Kg-1 soil, respectively. In the same dates, the concentration of clodinafop-propargyl in 10-20 cm soil depth was 0.319, 0.112, 0.215, 0.143 and 0.132 mg.Kg-1soil, respectively (Figure 3). Therefore, in 0-10 cm soil depth, at 62, 83, 104 and 128 days after this herbicide application, soil residues were 216.3, 134.7, 291.8 and 119.4% higher than 40 days after application, respectively. But in 10-20 cm soil depth at 62, 83,104 and 128 days after application, soil residues were 64.9, 32.6, 55.2 and 58.6% lower than 40 days after application, respectively. As a result, the observed data showed that in surface layer, 0-10 cm, the clodinafop-propargyl concentration was increased. Upward movement of clodinafoppropargyl towards the surface of soil was occurred in all treatments (Figure 3). This might be due to the upward flow of water in soil, that transport the herbicide to upper soil layers which is known as wick effect. The cracks in soil surface maybe another reason, because with cracks in soil surface, lack of sufficient contact time for washing herbicide into the lower soil layers, decrease leaching efficiency. The volatilization of herbicide in deeper soil layers could be another reason for upward flow of herbicide.

Figure 3: Clodinafop-propargyl concentration in soil profile at different days after application for different treatments
At 128 days after herbicide application in C1V treatment, the concentration of clodinafop-propargyl in 0-10 and 10-20 cm depths decreased by 44.0 and 7.0%, relative to 104 days after application, respectively. But it was increased 83.0 and 145.4% in 20-30 and 30-40 cm depths, respectively, which can be mostly attributed to the leaching process. A similar trend was observed for C2V and C2S treatments. In all treatments clodinafop-propargyl herbicide leached down gradually with time to soil depths of 90 cm.
The concentration of clodinafop-propargyl in 0-10 cm soil depths was decreased over time with a steeper slope in C2S than C2V, which represents the transport of herbicides down to lower depths in absence of vetiver grass (Figure 3). Concentrations of the herbicide did not increase significantly over time at depths of 40-50 and 50-60 cm. This demonstrates that not only vetiver grass can absorb this herbicide, but also its roots can stabilize herbicide at lower soil depths.
The concentration of accumulated clodinafop-propargyl herbicide in the roots and shoots of the vetiver grass is shown in Table 4. The total concentration of clodinafop-propargyl taken up by vetiver in C1V and C2V treatments were 0.404 and 0.54 mg.kg-1dry matter. The values of clodinafop-propargyl concentration in vetiver shoots of treatment were 115.5 and 242.6% higher than that vetiver roots in C1V and C2V treatments, respectively (Table 4). These results demonstrate that herbicide concentration in vetiver grass increased with an increase in herbicide application. The higher concentration was observed in the vetiver shoots.
| Treatment | Clodinafop-propargyl (mg.kg-1dry matter) | Vetiver |
|---|---|---|
| C1V | 0.128 | Roots |
| 0.276 | Shoots | |
| total | 0.404 | |
| C2V | 0.122 | Root |
| 0.418 | Shoot | |
| total | 0.54 |
Table 4: The clodinafop-propargyl concentration in roots and shoots of the vetiver grass
Dried weight of vetiver shoots and roots for all treatments are shown in Table 5. Dry weight of vetiver shoots in C1V and C2V treatments was decreased by 70 and 81% compared with C0V treatment, respectively. Additionally, dry weight of vetiver roots in C1V and C2V treatments was decreased by 44 and 60%, compared with the control treatment (C0V), respectively. There was also a significant difference among the dry weights of vetiver shoots and roots in different treatments at 5% level of probability, using Duncan multiple test. According to Tables 4 and 5, the vetiver removal of clodinafoppropargyl from soil in C1V and C2V treatments were 1198.8 and 1107.4 mg.ha-1.
| Treatments | Dry weight (kg ha-1) | Total | |
|---|---|---|---|
| Shoots | Roots | (kg ha-1) | |
| C0V | 12024.7 a | 3468.9 a* | 15439.6 a |
| C1V | 3453.0 b | 1920.4 b | 5373.4 b |
| C2V | 2250.8 c | 1365.4 c | 3616.2 c |
Table 5: Dried weight of vetiver shoots and roots. *Means followed by the same letters in columns are not significantly different at 5% level of probability, using Duncan multiple test.
Calibration of models
The C2V treatment was used for calibration and other treatments were used for validation of modified PRZM-3 and HYDRUS-1D models. The calibration parameters for both models have been shown in Table 6.
| Model | Kd | DL | µw | µs | DIFG | DIFW | Beta | UPTAKE | ENPY |
|---|---|---|---|---|---|---|---|---|---|
| cm3 mg-1 | Cm | day-1 | day-1 | cm2 day-1 | cm2 day-1 | - | - | kcal mole-1 | |
| HYDRUS-1D | 0.065 | 3.5 | 0.015 | 0.015 | 1730 | 0.45 | 0.72 | - | - |
| modified PRZM-3 | 0.065 | 3.5 | 0.015 | 0.015 | 1730 | - | - | 0.11 | 19.2 |
Table 6: Calibration parameters in HYDRUS-1D and modified PRZM-3 model. Kd: adsorption/partition coefficient for soil; .DL: Longitudinal dispersivity; µw: Decay rate in dissolved phase; µs: Decay rate in adsorbed phase; DIFW: Molecular diffusion coefficient in water; DIFG: Molecular diffusion coefficient in soil air; Beta: Adsorption isotherm coefficient; UPTAKE: plant pesticide uptake efficiency factor. ENPY: enthalpy of vaporization of the pesticide.
Estimation of both models for C2V treatment at the first sampling date (41 days after application) are favorable, but as time is elapsed, because of differences between the measured and simulated data in surface layer, 0-10 cm soil depth, the prediction of both models were not suitable (Figure 4). However, prediction of modified PRZM-3 model was better than HYDRUS-1D model over the time. As mentioned before, in the surface layer due to the upward movement of herbicides as a result of upward flow water (wick effect), the phenomenon of volatilization and the fractures on the soil surface, herbicide concentration has increased over time in the surface layer. As shown in Figure 4, the modified PRZM-3 model for prediction of herbicide concentration is more suitable than HYDRUS-1D model. Both models are not able to consider the fractures on the soil surface. However, phenomenon of volatilization is considered in both models. The PRZM-3 model is a specialized model to consider all dissipation processes of the herbicides in soil and groundwater. Therefore, this phenomenon could be considered more accurately in this model. As mentioned before, in modified PRZM-3 model, the solving method of water movement in soil was modified. Therefore, the modified PRZM-3 model had better prediction than the HYDRUS-1D model in surface layer of soil (Table 6). According to this table, the average values of NRMSE, d and CRM during the simulation in modified PRZM-3 model were 0.37, 0.89 and 0.03, respectively, and in HYDRUS-1D model were 0.63, 0.64 and 0.09, respectively. The increasing of NRMSE mainly is due to poor prediction of models in the soil surface layer (Figure 4).
| Day after application | Treatment | C1V (Validation) | C2V (Calibration) | C1S (Validation) | C2S (Validation) | ||||
|---|---|---|---|---|---|---|---|---|---|
| Statistical parameters | HYDRUS-1D | Modified PRZM-3 | HYDRUS-1D | Modified PRZM-3 | HYDRUS-1D | Modified PRZM-3 | HYDRUS-1D | Modified PRZM-3 | |
| 41 | NRMSE | 0.37 | 0.43 | 0.29 | 0.18 | 0.16 | 0.21 | 0.2 | 0.37 |
| D | 0.93 | 0.89 | 0.9 | 0.97 | 0.96 | 0.91 | 0.97 | 0.9 | |
| CRM | -0.08 | -0.07 | -0.08 | -0.05 | -0.12 | -0.16 | -0.04 | -0.19 | |
| 62 | NRMSE | 0.74 | 0.67 | 0.32 | 0.33 | 0.74 | 0.75 | 0.39 | 0.34 |
| D | 0.5 | 0.5 | 0.69 | 0.72 | 0.44 | 0.5 | 0.87 | 0.92 | |
| CRM | 0.26 | 0.13 | -0.14 | -0.18 | 0.06 | -0.05 | 0.2 | 0.05 | |
| 83 | NRMSE | 0.75 | 0.47 | 0.95 | 0.65 | 0.86 | 0.59 | 0.61 | 0.45 |
| D | 0.55 | 0.85 | 0.49 | 0.85 | 0.44 | 0.84 | 0.75 | 0.92 | |
| CRM | 0.38 | 0.3 | 0.09 | -0.02 | 0.24 | 0.2 | 0.1 | 0.06 | |
| 104 | NRMSE | 1.23 | 0.68 | 0.91 | 0.45 | 0.73 | 0.36 | 0.88 | 0.3 |
| D | 0.41 | 0.86 | 0.49 | 0.91 | 0.43 | 0.91 | 0.37 | 0.97 | |
| CRM | 0.46 | 0.31 | 0.36 | 0.26 | 0.38 | 0.32 | 0.13 | 0.06 | |
| 128 | NRMSE | 0.88 | 0.49 | 0.69 | 0.23 | 0.83 | 0.44 | 1.1 | 0.63 |
| D | 0.47 | 0.88 | 0.62 | 0.98 | 0.57 | 0.91 | 0.46 | 0.91 | |
| CRM | 0.54 | 0.4 | 0.23 | 0.12 | 0.43 | 0.34 | 0.17 | 0.03 | |
| Mean | NRMSE | 0.79 | 0.55 | 0.63 | 0.37 | 0.66 | 0.47 | 0.64 | 0.42 |
| D | 0.57 | 0.8 | 0.64 | 0.89 | 0.57 | 0.81 | 0.68 | 0.92 | |
| CRM | 0.31 | 0.22 | 0.09 | 0.03 | 0.2 | 0.13 | 0.11 | 0 | |
Table 6: The statistical parameters of clodinafop-propargyl prediction in HYDRUS-1D and modified PRZM-3 models.

Figure 4: Measured and simulated concentrations of clodinafoppropargyl in soil profile using the modified PRZM-3 and HYDRUS-1D models in C2V treatment (calibration) at different days after application: a) 41 days, b) 62 days, c) 83 days d) 104 days, e)128 days
Validation of models
As mentioned before, C2S, C1V and C1S treatments were used for Validation. In C2S treatment similar to C2V treatment, simulation of modified PRZM-3 model was better than HYDRUS-1D model. As shown in Figure 5, over time, the herbicide moved upwards and accumulated into the soil surface layers. In this treatment the mean values of NRMSE, d and CRM during the simulation in the modified PRZM-3 model were 0.42, 0.92 and 0.0, respectively, and in HYDRUS-1D model they were 0.64, 0.68 and 0.11, respectively. Therefore, modified PRZM-3 model predicted the herbicide concentration with higher accuracy than HYDRUS-1D. As C2V treatment, the main reason of reduction in the accuracy is inability of suitable prediction in the soil surface layer.

Figure 5: Measured and simulated concentrations of clodinafoppropargyl in soil profile using the modified PRZM-3 and HYDRUS-1D models in C2S treatment (validation)at different days after application: a) 41 days, b) 62 days, c) 83 days d)104 days, e)128 days.
Figures 6 and 7 showed the results of the measured and simulated clodinafop-propargyl concentration in soil by modified PRZM-3 and HYDRUS-1D models at different sampling times for C1V and C1S treatments, respectively. Based on statistical parameters (Table 7 and Figures 6 and 7) the prediction in these two treatments has been similar to C2V treatment (Table 7). Similar to other treatments, the modified PRZM-3 model predicted the herbicide concentration with higher accuracy than HYDRUS-1D model.

Figure 6: Measured and simulated concentrations of clodinafoppropargyl in soil profile using the modified PRZM-3 and HYDRUS-1D models in C1V treatment (validation) at different days after application: a) 41 days, b) 62 days, c) 83 days d) 104 days, e) 128 days.

Figure 7: Measured and simulated concentrations of clodinafoppropargyl in soil profile using the modified PRZM-3 and HYDRUS-1D models in C1S treatment (validation) at different days after application: a) 41 days, b) 62 days, c) 83 days d) 104 days, e) 128 days.
The measured and predicted of clodinafop-propargyl concentration in soil was compared with each other and to 1:1 line in Figure 8. The best prediction of both models was for C2V treatment (calibration treatment), but modified PRZM-3 model superiority is obvious.

Figure 8: Comparison of measured and predicted of clodinafoppropargyl as soil residues with 1:1 line for treatments of: a) C2V (calibration), b) C1V, c) C1S and d) C2S (validation) treatments.
Between three validation treatments, both models had best prediction in C2S treatment and worst prediction in the C1S treatment. In all treatments, the modified PRZM-3 model had better prediction than HYDRUS-1D model (Figure 8).
Validation and calibration of vetiver uptake
The measured and simulated values of cumulative absorbed herbicide by vetiver grass for C2V and C1V treatments are shown in Figure 9. It should be noted that the amount of absorbed herbicide by the vetiver has been measured only in the last sampling date, 128 days after herbicide application.

Figure 9: The measured and simulated values of cumulative absorbed clodinafoppropargyl by vetiver grass: a) C2V treatment (calibration) and b) C1V treatment (validation)
As shown in Figure 9, simulated value of the cumulative absorbed herbicide in 128 days after herbicide application for C1V (validation) and C2V (calibration) treatments in modified PRZM-3 model were 0.038 and 0.042 μg.cm-2, respectively, and in HYDRUS-1D model were 0.026 and 0.027 μg.cm-2, respectively, and the measured values were 0.022 and 0.02 μg.cm-2, respectively.
The simulation error for cumulative absorbed herbicide by vetiver grass using modified PRZM-3 model for C1V and C2V treatments were 75.8% and 110.3%, respectively, and using HYDRUS-1D model they were 21.8% and 34.8%, respectively. Therefore, the prediction of HYDRUS-1D model for clodinafop-propargyl uptake by vetiver grass is closer to the measured values. This is may be due to uptake mechanisms in modified PRZM-3 model. In this model plant uptake values only occur when the soil moisture is above the wilting point, specified by the user for each soil horizon, and sufficient nutrients are available. No temperature rate adjustment is performed, but all uptakes are stopped when soil temperature is below 4°C. If the uptake target is not met during a given time interval, whether due to nutrient, temperature, or moisture stress, then a deficit is accumulated and applied to the next time interval's target. If uptake later becomes possible, the program will attempt to make-up the deficit by taking-up nitrogen at a rate higher than the normal daily target, up to a userspecified maximum defined as a multiple of the target rate. The deficit is tracked for each soil layer, and is reset to zero at harvest, i.e. it does not carryover from one crop season to the next [38].
Dissipation equations
Terrestrial field dissipation (TFD) half-life is a physical-chemical property of pesticides. The half-life of a substance is defined as the time it takes for a substance to decrease its amount by half. The dissipation kinetics of the herbicides was determined by exponential relationships, which applied between soil residue concentrations against time, corresponding to first order rate equation.
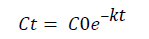 (5)
(5)
Where: C: value of pesticide at time t, mg/ha; C0: initial value of pesticide, mg/ha; k: dissipation rate constant, days-1; t: time, days
The half-life (t1/2) was determined from the k value (t1/2=Ln 0.5/k) for each experiment (Table 7). The mean half-lives of clodinafoppropargyl in C1V, C1S, C2V and C2S treatments in 0-30 cm soil profile were 17.3, 17.3, 13.9 and 14.3 days, respectively.
Conclusions
In this study, four herbicide treatments were used to investigate the herbicide concentration and its movement in soil profile at different days after application. The herbicide uptake by vetiver grass was also determined and predicted. All treatments were simulated by modified PRZM-3 and HYDRUS-1D models. The error percentage of the modified PRZM-3 and HYDRUS-1D model for herbicide concentrations in soil profile in all treatments was -6.3% and -15.8%, respectively. In general, the statistical parameters in model validation treatments showed that the accuracy of modified PRZM-3 model in estimating the concentration of the herbicide residues in soil profile were higher than that in HYDRUS-1D model.
The clodinafop-propargyl concentration in vetiver shoots of treatments were 115.5% and 242.6% higher than that vetiver roots in C1V and C2V treatments, respectively. These results demonstrated that herbicides uptake by vetiver grass increased with an increase in herbicide application. The highest accumulation was observed in the vetiver shoots. The predicted cumulative uptake of clodinafop propargyl by vetiver grass through modified PRZM-3 model (0.042 and 0.038 μg.cm-2 for C2V and C1V treatment, respectively) was about 1.5 times higher than the HYDRUS-1D model prediction (0.027 and 0.026 μg.cm-2 for C2V and C1V treatment, respectively). The simulations error of uptake this herbicide by modified PRZM-3 model in C2V and C1V treatments was 110.3% and 75.8%, respectively, and for HYDRUS-1D model were 34.8% and 20.45, respectively. In general, vetiver uptake prediction by the HYDRUS-1D model was more accurate than the modified PRZM-3 model.
References
- Kearney PC, Roberts T (1998) Pesticide remediation in soils and water. John Wiley & Sons Ltd.
- Izadi Darbandi A, Rashed Hasel MH, Mahmoodi G, Dehghan M (2013) Evaluation for some crops tolerance to remains of teribnoren methyl herbicide (granstar) in the soil. J Plant Protect 26: 362-369.
- Reichenauer TG, Germida JJ (2008) Phytoremediation of organic contaminants in soil and groundwater. Chem Sus Chem 1: 708-717.
- Salt DE, Smith RD, Raskin I (1998) Phytoremediation. Annu Rev Plant Physiol Plant Mol Biol 49: 643-668.
- Roongtanakiat N (2009) Vetiver phytoremediation for heavy metal decontamination. Pacific Rim Vetiver Network Technical Bull 1: 1-20.
- Truong PNV (2000) The global impact of vetiver grass technology on the environment, Proceedings of the second international vetiver conference. Thailand.
- Truong P, Van TT, Pinners E (2008) Vetiver System Applications: A Technical Reference Manual. Vetiver Network Int 76.
- Baghestani MA, Zand E, Soufizadeh S, Beheshtian M, Haghighi A, et al. (2008) Study on the efficacy of weed control in wheat (Triticum aestivum L.) with tank mixture of grass herbicides with broad leaved herbicides. Crop Prot 27: 104-111.
- Deihimfard R, Zand E (2006) Final Report of Study on Environmental Impacts of Herbicide Application in Wheat in Iran during the Past 10 years and Future Strategies to Optimize the Amount of Herbicide Application. Shahid Beheshti University Press, 41.
- Tang W, Shan B, Zhang H, Mao Z (2010) Heavy metal sources and associated risk in response to agricultural intensification in the estuarine sediments of Chaohu Lake Valley, East China. J Harzard Mater 176: 945-951.
- Panagopoulos Y, Makropoulos C, Mimikou M (2012) Decision support for diffuse pollution management. J Environ Modell Softw 30: 57-70.
- Sandoval-Carrasco CA, Ahuatzi-Chacón D, Galíndez-Mayer J, Ruiz-Ordaz N, Juárez-Ramírez C, et al. (2013) Biodegradation of a mixture of the herbicides ametryn, and 2, 4-dichlorophenoxyacetic acid (2, 4-D) in a compartmentalized biofilm reactor. J Bioresour Technol 145: 33–36.
- Gupta M, Garg N, Joshi H, Sharma M (2012) Persistence and mobility of 2, 4-D in unsaturated soil zone under winter wheat crop in sub-tropical region of India. Agri Ecosys Environ 146: 60-72.
- Kodešová R, Kocárek M, Kodeš V, Šimunek J, Kozák J (2008) Impact of soil micromorphological features on water flow and herbicide transport in soils. Vadose Zone J 7: 798-809.
- Noshadi M, Jamshidi S, Forouharfar F (2016) Analysis of 2,4-D Concentration in Silty Clay Soil Under Two Irrigation Regimes Using LEACHP and PRZM-3 Models. J Sci Technol Agri Nat Res Water Soil Sci 19: 77-87.
- Agricultural Ministry of Iran (2009) Statistical report on wheat and barely 2008-2009. Tehran: Iranian Ministry of Agricultural (In Persian).
- EPA (2003) Draft Assessment Report: European Commission ClodinafopPropargyl. Annex B 3: 76–100.
- EPA (2004) Chemicals evaluated for carcinogenic potential. science information management. Branch Health Effects Division Office of Pesticide Programs.
- Šimunek J, Huang K, Van Genuchten MT (1997) The HYDRUS-ET Software Package for Simulating the One-Dimentional Movement of Water, Heat and Multiple Solutes in Variably-Saturated Media, Version 1.1. Bratislava: Inst Hydrology Slovak Acad Sci.
- Zhou Q, Salve R, Liu HH, Wang JS, Hudson D (2006) Analysis of a mesoscale infiltration and water seepage test in unsaturated fractured rock: Spatial variabilities and discrete fracture patterns. J Contam Hydrol 87: 96-122.
- Brooks RH, Corey AT (1964) Hydraulic properties of porous media. Hydrol. Paper No. 3, Colorado State Univ. Fort Collins. CO.
- Vogel T, Císlerová M (1988) On the reliability of unsaturated hydraulic conductivity calculated from the moisture retention curve. Transport in Porous Media. 3: 1-15.
- Durner W (1994) Hydraulic conductivity estimation for soils with heterogeneous pore structure. Water Resour Res 32: 211-223.
- Kosugi K (1996) Lognormal distribution model for unsaturated soil hydraulic properties. Water Resour Res 32: 2697-2703.
- Šimunek J, van Genuchten M T, Šejna M (2012) Hydrus: model use, calibration, and validation. American Society of Agricultural and Biological Engineers 55: 1261-1274.
- Feddes RA, Kowalik PJ, Zaradny H (1978) Simulation of Field Water Use and Crop Yield. J Plant Nutr Soil Sci 143: 254–255.
- Maas EV (1990) Crop salt tolerance. In "Agricultural salinity assessment and management", KK Tanji (ed.). ASCE Manuals and Reports on Engineering practice. No 71. New York.
- Allen RG, Pereira LS, Raes D, Smith M (1998) Crop evapotranspiration-Guidelines for computing crop water requirements-FAO Irrigation and drainage paper 56. FAO. Rome 300. D05109.
- Šimunek J, Hopmans JW (2009) Modeling compensated root water and nutrient uptake. Ecol Model 220: 505-521.
- Ladu JLC, Zhang DR (2011) Modeling atrazine transport in soil columns with HYDRUS-1D. Water Sci Eng 3: 003.
- Noshadi M, Jamshidi S (2014) Modification of water movement equations in the PRZM3 for simulating pesticides in soil profile. Agri Water Manag 143: 38-47.
- Darajeh N, Idris A, Aziz AA, Truong P (2014) Vetiver system technology for phytoremediation of Palm Oil Mill effluent (POME). 1st Philippine conference on vetiver.
- Armin M, Zand E, Baghestani MA (2008) The effect of low herbicide dose of clodinafop-propargyl on percentage of wild oat (Avena Ludoviciana) control, yield and economic return of wheat (Triticum Aestivium). J Plant Prot 22: 109-118.
- Nagel TG (2009) The QuEChERS method-a new approach in pesticide analysis of soils. J Horticult Forest Biotechnol 13: 391.
- Zelles L, Adrin P, Bai QY, Stepperk K, Adrain MV, et al. (1991) Microbial activity merasured in soils stored under different temperature and humidity conditions. Soil Biol Biochem 23: 955-962.
- Pesaro M, Widmer F, Nicollier G, Zeyer J (2003) Effects of freeze-thaw stress during soil storage on microbial communities and methidathion degradation. Soil Biol Biochem 35: 1049-1061.
- Loague K, Green RE (1991) Statistical and graphical methods for evaluating solute transport model: Overview and application. J Contam Hydrol 7: 15-73.
- Suárez LA (2006) PRZM-3, A Model for Predicting Pesticide and Nitrogen Fate in the Crop Root and Unsaturated Soil Zones: Users Manual for Release 3.12.2. U.S. Environmental Protection Agency.
Citation: Noshadi M, Foroutani A, Sepaskhah A (2017) Analysis of Clodinafop-propargyl Herbicide Transport in Soil Profile under Vetiver Cultivation using HYDRUS-1D and Modified PRZM-3 Models. Toxicol Open Access 3: 120. Doi: 10.4172/2476-2067.1000120
Copyright: © 2017 Noshadi M, et al. This is an open-access article distributed under the terms of the Creative Commons Attribution License, which permits unrestricted use, distribution, and reproduction in any medium, provided the original author and source are credited.
Share This Article
Open Access Journals
Article Tools
Article Usage
- Total views: 5231
- [From(publication date): 0-2017 - Apr 24, 2024]
- Breakdown by view type
- HTML page views: 4485
- PDF downloads: 746