Bangladesh; GIS; Meteorological drought; Rainfall data; Spatial analysis; SPI
Received: 22-Feb-2018 / Accepted Date: 23-Mar-2018 / Published Date: 27-Mar-2018 DOI: 10.4172/2157-7617.1000457
Abstract
The Standardized Precipitation Index (SPI) was computed in three different cropping seasons namely, Pre-Kharif, Kharif and Rabi based on the monthly precipitation data of thirty-five meteorological stations over Bangladesh during the period 1980–2015. In this study, different features of meteorological drought including frequency of drought, dry and wet periods, percentage of drought area, temporal and spatial variations of drought in Bangladesh were examined. The results revealed that the most significant increasing trend of drought area was found in Rabi season (8.66% per decade) and decreasing trend was found in Kharif season (2.47% per decade). In Kharif season, the trend of drought area was found increasing in northern region with a rate of 2.63% per decade where central region, eastern region and southern and western region were decreasing with a rate of 1.06%, 3.02% and 3.02% per decade, respectively. All drought affected areas were experienced by moderate, severe and extreme droughts in several years during the study period in three seasons. The significant drought events were found in 1992, 2008, 2012 and 2014 in Pre-Kharif, 1981, 1985, 1992, 1994, 2006 and 2012 in Kharif and 1985, 1986, 2005, 2006, 2009, 2010 and 2012 in Rabi season. Some areas of southern and western regions, central regions, eastern regions and most of the northern region were more vulnerable to meteorological drought. Major finding of this study was Pre-Kharif and Rabi season were the most vulnerable to meteorological drought that indicates high seasonal rainfall anomaly in most of the regions of Bangladesh.
Keywords: Bangladesh; GIS; Meteorological drought; Rainfall data; Spatial analysis; SPI
Introduction
A crop faces many biotic and abiotic stresses during their growing period. Among the different abiotic stresses drought is becoming a great threat for crop production due to climate change. Drought is nothing but a natural disaster which prevails due to scarcity of water or moisture. In general drought is classified as meteorological, agricultural and hydrological droughts which are differing from one another by depending on intensity, duration and spatial coverage [1]. Meteorological drought is directly related to rainfall which prolongs existence consequence the agricultural drought [2]. In addition, dry winds, less precipitation, high temperature and many other factors also responsible for causing meteorological drought.
Bangladesh is a more vulnerable to climate change due to its geographical condition. Among the many abiotic stresses drought was more prominent in northern and south-western regions of Bangladesh compared to the other parts of the country [3]. On the other hand, the north-western region was the most vulnerable region of the country [4] which experienced most severe drought because of high variability in rainfall [5]. Three distinct seasons can be recognized from climatic point of view: the dry winter season Rabi (November to February), the pre-monsoon hot summer season Pre-Kharif (March to May), and the rainy monsoons season Kharif (June to October) [6]. Drought has a great impact on the agricultural production of Bangladesh. During Kharif season, T. Aman rice is tremendously affected by drought whereas in Rabi and pre-kharif season; wheat, potato, mustard and T. Aus rice are mainly affected. Early drought delays transplanting as well as harvesting time of aman rice which affects the cultivation of rabi crops after T. Aman. As consequences a large area remains fellow after T. Aman due to lack of optimum growing periods for rabi crops. In case of rice, early drought represses tillering and vegetative growth whereas terminal drought in Kharif season affects the heading, panicle initiation and milking stages of rice and reduces the achievable yield. In severely drought prone areas, yield losses may exceed 50 percent where in general it varies from 35 to 45 percent depending on rainfall, soil types and planting time of the crops. Conversely, in moderate drought prone areas, yield losses fluctuate from 20 to 35 percent [7].
For monitoring drought, there are various indices that measure how much precipitation for a given period of time has deviated from historically established norms. Some of the broadly used drought indices include Palmer Drought Severity Index (PDSI), Surface Water Supply Index (SWSI), Standardized Precipitation Index (SPI), Reclamation Drought Index (RDI) and Crop Moisture Index (CMI).
To see the beginning and termination of drought, duration and severity, Datta [8] compared the Palmer Drought Severity Index (PDSI) with the SPI and the Harbst methods. She found that all the three methods identified the same drought years in the N-W region of Bangladesh. To develop map and the spatial extents of drought hazards in different time steps, a study was carried out by Shamsuddin and Behrawan [9] using Standardized precipitation index [10,11] method. Jalpa and Parekh [12] studied various drought indexes and concluded that SPI permits comparisons over space and time better than any other index. Many other researchers [13-17] have applied SPI to analyze the drought characteristics in various parts of India. Also, some researchers [18-21] used the SPI and other indexes to evaluate the spatial and temporal drought characteristics in various regions across the world.
The SPI computation for a specific time scale and location requires a long term monthly precipitation data. The event of drought in the study area is identified using SPI in multiple time scales. In the present study SPI has been used to observe the drought event of Prekharif, Kharif and Rabi seasons from the year 1980 to 2015. The main objective of this study is to assess the spatial and temporal pattern of meteorological drought over different regions of Bangladesh using the Standardized Precipitation Index.
Materials and Methods
Monthly precipitation data of 35 meteorological stations were taken from Bangladesh Meteorological Department for a maximum period of 36 years from 1980 to 2015. The total area of Bangladesh (latitudes 20°34´N and 26°38´N and longitudes 88°01´E and 92°41´E) is divided into northern region (NR), southern and western region (SWR), central region (CR) and eastern region (ER) for better understanding of the meteorological drought (Figure 1). The calculation of Standardized Precipitation Index (SPI) [10,11] was followed in this research to assess anomalous and extreme precipitation developed the Standardized Precipitation Index (SPI) for the purpose of defining and monitoring drought [10,11]. Among others, the Colorado Climate Center, the Western Regional Climate Center, and the National Drought Mitigation Center use the SPI to monitor current states of drought in the United States. The nature of the SPI allows an analyst to determine the rarity of a drought or an anomalously wet event at a particular time scale for any location in the world that has a precipitation record. Thorn [22] found the gamma distribution to fit climatological precipitation time series well. The gamma distribution is defined by its frequency or probability density function:
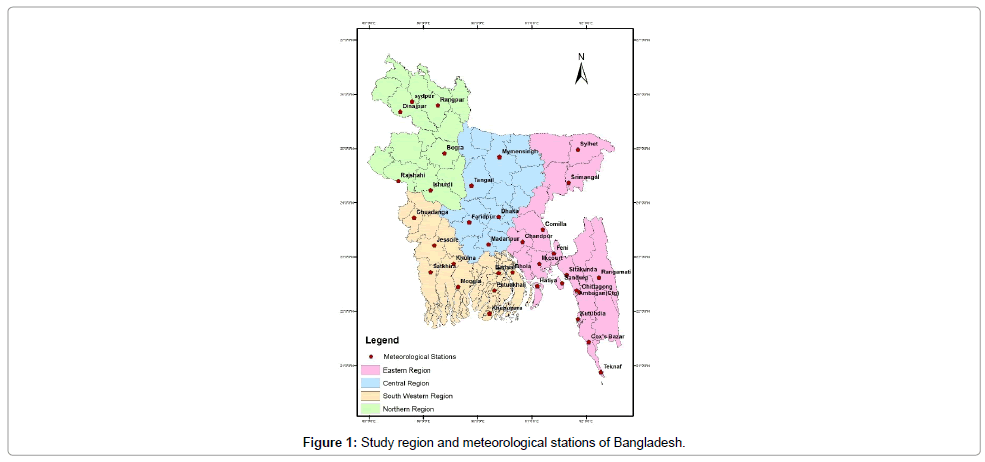
Figure 1: Study region and meteorological stations of Bangladesh.
Where, α>0 (α is a shape parameter), β>0 (β is a scale parameter), x>0 (x is the precipitation amount) and  is the gamma function)
Computation of the SPI involves fitting a gamma probability density function to a given frequency distribution of precipitation totals for a station. The alpha and beta parameters of the gamma probability density function are estimated for each station, for each time scale of interest (3 months, 12 months, 48 months, etc.), and for each month of the year. From Thorn HC, the maximum likelihood solutions are used to optimally estimate α and β:
Where, 
n = number of precipitation observations.
The resulting parameters are then used to find the cumulative probability of an observed precipitation event for the given month and time scale for the station in question. The cumulative probability is given by:
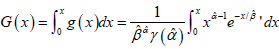
Letting,  this equation becomes the incomplete gamma function:
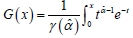
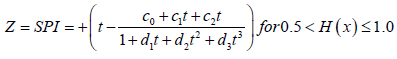
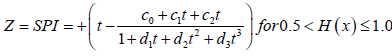
Since the gamma function is undefined for x=0 and a precipitation distribution may contain zeros, the cumulative probability becomes: H (x) = q + (1− q)G(x) [22] states that q can be estimated by q = m / n , where q is the probability of a zero. If m is the number of zeros in a precipitation time series and n is the number of precipitation observations. Thorn [22] uses tables of the incomplete gamma function to determine the cumulative probability G(x) [10] use an analytic method along with suggested software code from Press et al. [23] to determine the cumulative probability. The cumulative probability, H(x), is then transformed to the standard normal random variable Z with mean zero and variance of one, which is the value of the SPI. Then standardized precipitation index is calculated by:
Where:
Conceptually, the SPI represents a z-score, or the number of standard deviations above or below that an event is from the mean. To find out SPI value; 3-month rainfall data of pre-kharif season, 4-month data of Rabi season and 5-month data of season were analyzed through R programing software. After that, obtained SPI value was classified according to the drought classification of World Meteorological Organization (Table 1). The most common first order two states Markov Chain Model [24] was used to assess the dry and wet periods of all studied stations. Time series of annual drought percentage of area for all study station of Bangladesh (and various regions within) were calculated based on the ratio of the number of stations with SPI ≤ 1.0 to the related total number of study stations or the regions [25]. To analyze the variations of the drought areas, linear regression methods were used to detect the changing trend of the annual percentage of drought area at different significance levels for the different regions of Bangladesh. Variations of drought areas were also plotted and investigated by different seasons (Pre-Kharif, Kharif and Rabi) of Bangladesh. Geographic Information System (GIS) has been used for mapping of spatial extent of meteorological drought from point data. SPI values of 35 meteorological stations have been determined then with these SPI value point shape file prepared by ArcGIS10 software. Spatial analysis (surface interpolation by ordinary krigging) with these point data were done by the ArcGIS10.
| SPI Values | Classification |
|---|---|
| ≥ 0.00 | No Drought |
| < 0.00 to -0.99 | Normal Drought |
| -1.00 to -1.49 | Moderately Drought |
| -1.50 to -1.99 | Severely Drought |
| -2.00 and less | Extremely Drought |
Table 1: Standardized Precipitation Index (SPI) values.
Result and Discussion
The temporal and spatial variation of meteorological drought in the study area has been identified using SPI in multiple time scales. The SPI value for 3-months, 4-months and 5-months’ time scales have been calculated from 1980 to 2015 for 35 meteorological stations. Descriptive statistics of number of drought years, percentage of dry and wet periods of Pre-Kharif, Kharif and Rabi seasons of the study periods has been presented in the Table 2.
| Region | SL | Station Name | Extreme Drought (Year) | Severe Drought (Year) | Moderate Drought Year) | Normal Drought (Year) | Dry Period | Wet Period | ||||||||||||
|---|---|---|---|---|---|---|---|---|---|---|---|---|---|---|---|---|---|---|---|---|
| Pre Kharif |
Kharif | Rabi | Pre Kharif |
Kharif | Rabi | Pre Kharif |
Kharif | Rabi | Pre Kharif |
Kharif | Rabi | Pre Kharif |
Kharif | Rabi | Pre Kharif | Kharif | Rabi | |||
| Northern Region | 1 | Bogra | 0 | 1 | 0 | 3 | 0 | 3 | 3 | 5 | 2 | 12 | 15 | 12 | 50.00 | 58.33 | 47.22 | 50.00 | 41.67 | 52.78 |
| 2 | Dinajpur | 2 | 0 | 0 | 1 | 3 | 0 | 4 | 2 | 6 | 7 | 13 | 9 | 40.00 | 51.43 | 42.86 | 60.00 | 48.57 | 57.14 | |
| 3 | Ishurdi | 0 | 1 | 0 | 1 | 1 | 5 | 5 | 5 | 2 | 14 | 12 | 8 | 55.56 | 52.78 | 41.67 | 44.44 | 47.22 | 58.33 | |
| 4 | Rajshahi | 0 | 2 | 0 | 1 | 1 | 2 | 3 | 2 | 3 | 14 | 12 | 11 | 50.00 | 47.22 | 44.44 | 50.00 | 52.78 | 55.56 | |
| 5 | Rangpur | 1 | 1 | 0 | 1 | 2 | 0 | 2 | 1 | 7 | 13 | 12 | 9 | 47.22 | 44.44 | 44.44 | 52.78 | 55.56 | 55.56 | |
| 6 | Sydpur | 0 | 1 | 0 | 0 | 1 | 0 | 2 | 1 | 4 | 10 | 12 | 7 | 52.00 | 60.00 | 44.00 | 48.00 | 40.00 | 56.00 | |
| Southern and Western Region | 7 | Barisal | 0 | 0 | 0 | 1 | 4 | 2 | 1 | 2 | 4 | 20 | 12 | 10 | 61.11 | 50.00 | 44.44 | 38.89 | 50.00 | 55.56 |
| 8 | Bhola | 0 | 0 | 1 | 1 | 2 | 4 | 6 | 3 | 3 | 12 | 13 | 7 | 52.78 | 50.00 | 41.67 | 47.22 | 50.00 | 58.33 | |
| 9 | Chuadanga | 0 | 1 | 0 | 2 | 1 | 3 | 1 | 2 | 3 | 13 | 7 | 7 | 59.26 | 40.74 | 48.15 | 40.74 | 59.26 | 51.85 | |
| 10 | Hatiya | 0 | 0 | 0 | 0 | 0 | 0 | 0 | 2 | 0 | 16 | 8 | 14 | 51.62 | 32.26 | 45.16 | 48.38 | 67.74 | 54.84 | |
| 11 | Jessore | 1 | 0 | 0 | 1 | 2 | 3 | 2 | 3 | 2 | 18 | 12 | 13 | 61.11 | 47.22 | 50.00 | 38.89 | 52.78 | 50.00 | |
| 12 | Khepupara | 0 | 1 | 0 | 2 | 2 | 1 | 3 | 1 | 1 | 14 | 15 | 16 | 52.78 | 52.78 | 50.00 | 47.22 | 47.22 | 50.00 | |
| 13 | Khulna | 0 | 2 | 0 | 2 | 0 | 2 | 1 | 2 | 4 | 17 | 15 | 12 | 55.56 | 52.78 | 50.00 | 44.44 | 47.22 | 50.00 | |
| 14 | M. Court | 0 | 0 | 0 | 2 | 2 | 3 | 5 | 3 | 3 | 11 | 15 | 9 | 50.00 | 55.56 | 41.67 | 50.00 | 44.44 | 58.33 | |
| 15 | Mongla | 0 | 1 | 2 | 2 | 0 | 1 | 2 | 3 | 0 | 10 | 9 | 9 | 56.00 | 52.00 | 48.00 | 44.00 | 48.00 | 52.00 | |
| 16 | Patuakhali | 1 | 1 | 0 | 0 | 2 | 3 | 2 | 2 | 3 | 17 | 12 | 11 | 57.14 | 48.57 | 48.57 | 42.86 | 51.43 | 51.43 | |
| 17 | Satkhira | 0 | 1 | 0 | 3 | 0 | 3 | 2 | 5 | 4 | 15 | 11 | 10 | 55.56 | 47.22 | 47.22 | 44.44 | 52.78 | 52.78 | |
| Central Region | 18 | Chandpur | 0 | 0 | 2 | 0 | 1 | 1 | 4 | 2 | 2 | 15 | 18 | 12 | 54.29 | 60.00 | 48.57 | 45.71 | 40.00 | 51.43 |
| 19 | Comilla | 1 | 1 | 0 | 2 | 1 | 2 | 1 | 5 | 4 | 16 | 10 | 11 | 55.56 | 47.22 | 47.22 | 44.44 | 52.78 | 52.78 | |
| 20 | Dhaka | 0 | 1 | 2 | 2 | 2 | 2 | 2 | 1 | 3 | 16 | 14 | 8 | 55.56 | 50.00 | 41.67 | 44.44 | 50.00 | 58.33 | |
| 21 | Faridpur | 1 | 0 | 2 | 2 | 3 | 2 | 4 | 4 | 2 | 10 | 13 | 10 | 47.22 | 55.56 | 44.44 | 52.78 | 44.44 | 55.56 | |
| 22 | Madaripur | 0 | 1 | 0 | 0 | 0 | 4 | 6 | 3 | 4 | 13 | 16 | 8 | 52.78 | 55.56 | 44.44 | 47.22 | 44.44 | 55.56 | |
| 23 | Mymensingh | 1 | 0 | 0 | 1 | 3 | 2 | 3 | 2 | 4 | 13 | 13 | 11 | 50.00 | 50.00 | 47.22 | 50.00 | 50.00 | 52.78 | |
| 24 | Tangail | 0 | 0 | 0 | 2 | 1 | 2 | 2 | 3 | 4 | 7 | 11 | 6 | 41.38 | 51.72 | 41.38 | 58.62 | 48.28 | 58.62 | |
| Eastern Region | 25 | Ambagan (Ctg) | 0 | 0 | 0 | 1 | 1 | 1 | 1 | 1 | 3 | 7 | 5 | 3 | 52.94 | 41.18 | 41.18 | 47.06 | 58.82 | 58.82 |
| 26 | Chittagong | 0 | 0 | 0 | 0 | 0 | 0 | 5 | 1 | 5 | 14 | 13 | 12 | 52.78 | 38.89 | 47.22 | 47.22 | 61.11 | 52.78 | |
| 27 | Cox's Bazar | 0 | 1 | 0 | 4 | 0 | 4 | 2 | 2 | 3 | 11 | 13 | 10 | 47.22 | 44.44 | 47.22 | 52.78 | 55.56 | 52.78 | |
| 28 | Feni | 0 | 2 | 3 | 3 | 3 | 0 | 1 | 0 | 2 | 11 | 10 | 11 | 41.67 | 41.67 | 44.44 | 58.33 | 58.33 | 55.56 | |
| 29 | Kutubdia | 0 | 0 | 0 | 1 | 0 | 2 | 6 | 4 | 3 | 7 | 15 | 9 | 45.16 | 61.29 | 45.16 | 54.84 | 38.71 | 54.84 | |
| 30 | Rangamati | 1 | 0 | 0 | 2 | 2 | 4 | 4 | 4 | 1 | 10 | 9 | 14 | 47.22 | 41.67 | 52.78 | 52.78 | 58.33 | 47.22 | |
| 31 | Sandwip | 0 | 0 | 0 | 2 | 2 | 0 | 3 | 3 | 9 | 12 | 13 | 6 | 47.22 | 50.00 | 41.67 | 52.78 | 50.00 | 58.33 | |
| 32 | Sitakunda | 2 | 1 | 0 | 1 | 1 | 4 | 1 | 3 | 4 | 16 | 11 | 8 | 55.56 | 44.44 | 44.44 | 44.44 | 55.56 | 55.56 | |
| 33 | Srimangal | 0 | 0 | 0 | 1 | 2 | 4 | 3 | 1 | 1 | 14 | 13 | 10 | 50.00 | 44.44 | 41.67 | 50.00 | 55.56 | 58.33 | |
| 34 | Sylhet | 0 | 1 | 1 | 4 | 0 | 1 | 2 | 3 | 2 | 11 | 15 | 17 | 47.22 | 52.78 | 58.33 | 52.78 | 47.22 | 41.67 | |
| 35 | Teknaf | 1 | 2 | 0 | 4 | 0 | 3 | 2 | 0 | 4 | 10 | 16 | 10 | 44.44 | 50.00 | 47.22 | 55.56 | 50.00 | 52.78 | |
Table 2: Descriptive statistics of number of drought years and percentage of dry and wet periods of Pre-Kharif, Kharif and Rabi seasons during 1980-2015.
Meteorological drought assessment of northern region
Evaluation of meteorological drought of Pre-Kharif season, it is possible to explain that two years extreme drought in Dinajpur, three years severe drought in Bogra, five years moderate drought in Ishurdi, fourteen years normal drought was occurred in Rajshahi and Ishurdi (Table 2). The highest percentage of dry period were found in Ishurdi (55.56%) followed by Syedpur (52%), Rajshahi and Bogra (50%) in Pre- Kharif season. On the other hand, two extreme droughts in Rajshahi, three severe droughts in Dinajpur, fifteen normal droughts in Bogra and five moderate droughts in Bogra and Ishurdi were prevailed during Kharif season. The highest frequencies of dry period were 60.00% in Syedpur and 44.44% in Rangpur. In Rabi season, Ishurdi faced the highest five years severe drought whereas seven years moderate drought was occurred in Rangpur. The highest percentage (47.22%) of dry period was found in Bogra whereas 44.44% was found in Rajshahi and Rangpur.
Meteorological drought assessment of southern and western region
Analyzed data of meteorological drought of Pre-Kharif season showed that one-year extreme drought was occurred in Jessore and Patuakhali station; whereas the highest number of severe drought was found in Satkhira and two years extreme drought was found in Chuadanga, Khepupara, Khulna, Maijdi Court and Mongla stations. The large number of moderate drought was six years and five years in Bhola and Maijdi court, respectively. On the other hand, highest eighteen years normal drought in Jessore and seventeen years normal drought was happened in Khulna and Patuakhali station. The percentage of dry period was greater than 50% for all stations in southern and western region during Pre-Kharif season (Table 2). According to the data of Kharif season, two years extreme drought in Khulna, two years severe drought was in Bhola, Jessore, Khepupara, Maijdi Court and Patuakhali. Whereas five years moderate drought was appeared in Satkhira. The dry periods of most of the stations were ranges from 45% to 55% (Table 2). In case of Rabi season, highest two years extreme drought was in Mongla and four years severe drought was found in Bhola. In addition, four years moderate drought was prevailed in Barisal, Khulna and Satkhira during rabi seasons (Table 2). Also, all of the stations were shown the dry period ranges from 41.67% to 50.00%. From these three seasons the highest percentage of dry period was found in Pre-Kharif season.
Meteorological drought assessment of central region
The meteorological information of Chandpur, Comilla, Dhaka, Faridpur, Madaripur, Mymensingh and Tangail stations were evaluated to assess the meteorological drought of central region. In Pre-Kharif season, it was revealed that one-year extreme drought in Comilla, Faridpur and Mymensingh stations; two years severe droughts in Comilla, Dhaka, Faridpur and Tangail stations; six years moderate droughts in Madaripur station and maximum sixteen years normal droughts was occurred in Dhaka and Comilla stations. Moreover, in Kharif season; the highest percentage of dry period was 55.56% in Comilla and Dhaka (Table 2). During Kharif season the highest oneyear extreme drought in Comilla, Dhaka and Madaripur; severe three year’s drought in Faridpur and Mymensingh; moderate five years drought was occured in Comilla. And the percentage of dry period was 60% in Chandpur and 55.56% in Madaripur and Mymensingh (Table 2). In Rabi season, two years extreme drought in Chandpur, Dhaka and Faridpur; four years severe droughts in Madaripur; four years moderate droughts in Comilla, Madaripur, Mymensingh and Tangail and maximum twelve years normal droughts were happened in Chandpur. Most of the stations expressed dry periods less than 50% (Table 2). Therefore, during Rabi season central region of Bangladesh was found large wet period than others region.
Meteorological drought assessment of eastern region
In Pre-Kharif season, Sitakunda faced the highest two years extreme drought, Sylhet, Cox’s Bazar and Teknaf faced four years severe droughts, Kutubdia confronted highest six years moderate droughts and Sitakunda faced sixteen years normal droughts of total drought years. Among them the highest dry period percentage (55.56%) was found in Sitakunda (Table 2). On the ther hand, Feni and Teknaf stations were found highest two years of extreme drought in Kharif season where Feni was also faced three years severe droughts; Kutubdia and Rangamati were faced four years moderate droughts and Teknaf faced sixteen years normal droughts. Highest percentage (61.29%) of dry period was found in Kutubdia (Table 2). In Rabi season, three years extreme droughts occurred in Feni; four years severe droughts in Cox’s Bazar, Rangamati, Sitakunda and Srimangal; nine years moderate droughts in Sandwip and seventeen years normal droughts in Sylhet during study period. And the highest percentage (58.33%) of dry period was found in Sylhet station (Table 2).
Seasonal variation of droughts in different region of Bangladesh
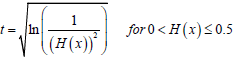
Drought years, which were defined as years with drought percentage more than 40% [26] showed different variation patterns in different regions. Figures 1-3 presented the changes and linear trends of drought areas (SPEI ≤ 1) from 1980 to 2015 over three cropping seasons (Pre- Kharif, Kharif and Rabi) of different regions of Bangladesh. In case of Pre-Kharif season (Figure 2), the most significant increasing trend of drought area was found in central region with a rate of 7.18% per 10 years followed by southern and western region with a rate of 5.42% per 10 years and northern region with a rate of 1.31% per 10 years. Eastern region shows decreasing trend with a rate of 2.19% per 10 years. In Kharif season, only northern region showed increasing trends with a rate of 2.63% per 10 years and the other three regions namely central region, eastern region and southern and western region were found decreasing trend 1.05%, 3.02% and 3.02% per 10 years respectively (Figure 3). Also, in Rabi season, the highest increasing rate of droughts areas were found in eastern region (11.11%) followed by northern region (8.22%), southern and western region (7.56%) and central region (6.79%) per 10 years (Figure 4).
Figure 2: Percentage of drought area in Pre-Kharif season over different regions of Bangladesh (a) Central Region (CR), (b) Eastern Region (ER), (c) Southern and Western Region (SWR) and (d) Northern Region (NR).
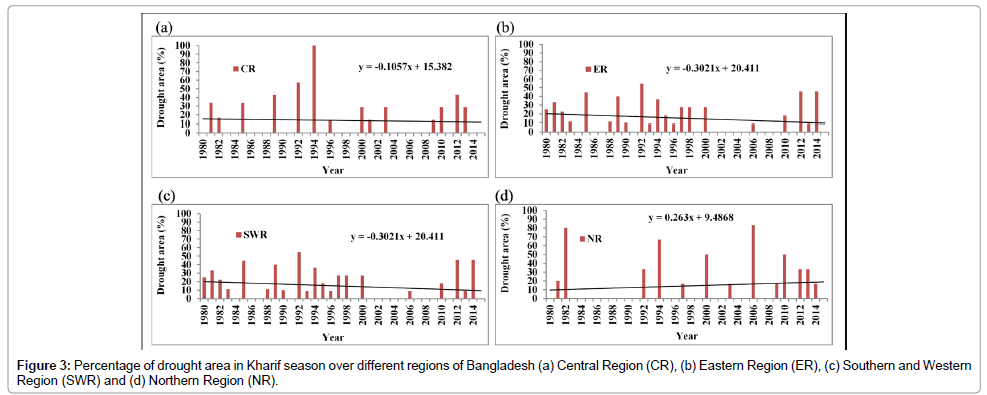
Figure 3: Percentage of drought area in Kharif season over different regions of Bangladesh (a) Central Region (CR), (b) Eastern Region (ER), (c) Southern and Western Region (SWR) and (d) Northern Region (NR).
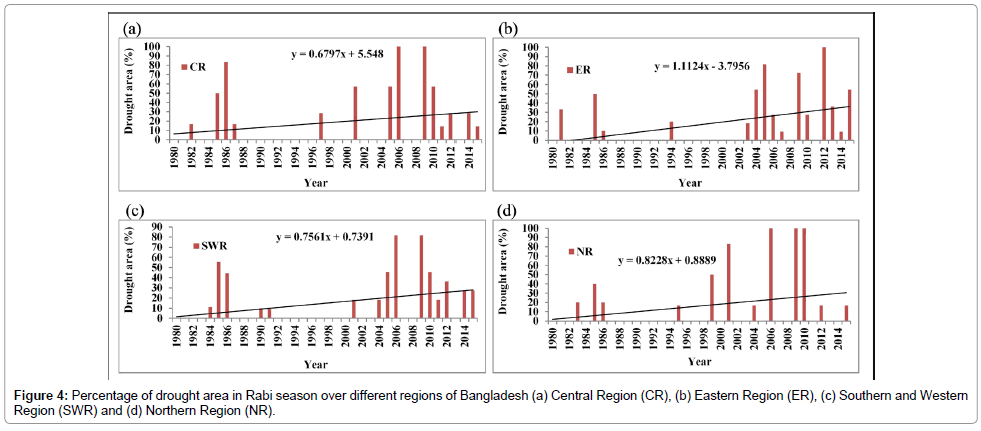
Figure 4: Percentage of drought area in Rabi season over different regions of Bangladesh (a) Central Region (CR), (b) Eastern Region (ER), (c) Southern and Western Region (SWR) and (d) Northern Region (NR).
Figure 5 presented the changes and linear trends of drought areas during 1980-2015 over different seasons of Bangladesh. The most significant increasing trend of drought was found in Rabi season with a rate of 8.66% per 10 years and Pre-Kharif season with a rate of 2.57% per 10 years. Where, Kharif season represented decreasing trend with a rate of 2.47% per 10 years. Widespread and large droughts occurred in Pre-Kharif season in the years of 1992, 1995, 2007, 2008, 2012 and 2014 over the different regions of Bangladesh. Among the all regions of Bangladesh, significant drought years of Kharif seasons were 1981, 1985, 1992, 1994, 2006 and 2012. And highest drought year in Rabi season were 1985, 1986, 2005, 2006, 2009, 2010 and 2012.
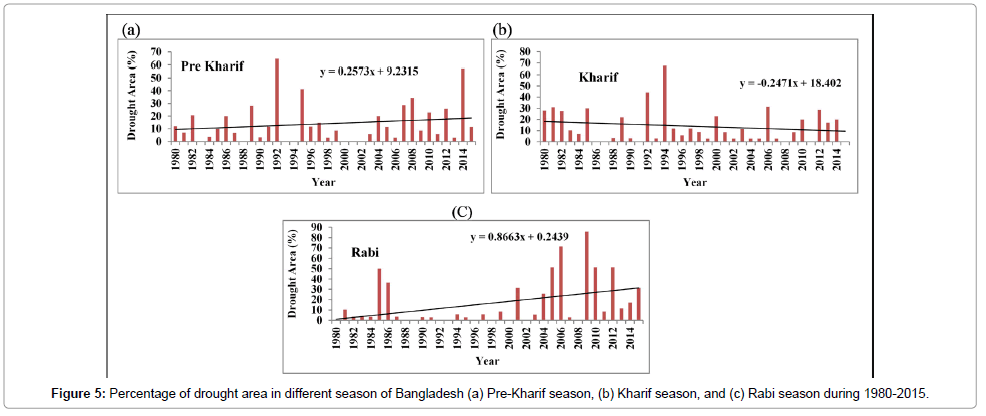
Figure 5: Spatial distributions of meteorological drought in 1995, 2008, 2012 and 2014 of Pre-Kharif season.
Spatial distributions of meteorological drought in Bangladesh
In this study, drought intensity was investigated for three cropping seasons of Bangladesh. The SPI value for Pre-Kharif, Kharif and Rabi seasons have been analyzed through geo-spatial analysis using GIS. This type of analysis will clearly help to identify the intensity of drought in the study region. In Pre-Kharif season, moderate, severe and extreme drought events were occurred about 41% of total area in 1995 and affected northern, south-western and few eastern regions which covered by Rajshahi, Dinajpur, Rangpur, Bogra, Jessore, Chuandanga, Sylhet, Bhola and its neighborhood areas (Figure 6). About 34% of total areas in south-western and eastern regions were affected by meteorological drought in 2008 with the neighborhood areas; Patuakhali, Bhola, Mongla, Noakhali, Chandpur, Comilla, Chittagong Rangamati Cox’s Bazar. Moderate and severe droughts were found in most of the northern and southern-western regions in 2012. In 2014, drought shifted to central and eastern region and affected about 57% of the study area by severe and moderate drought conditions. Again, from the spatial variation of meteorological drought in Kharif season (Figure 7), it is seen that the severe and moderate drought events were occurred in few parts of northern region, south-western region, central region and eastern region in 1981, which was 31% of total area. Extreme, severe and moderate drought events were found about 68% of the total area of Bangladesh in 1994. In the same year, Northern region, most of the central region and some area of eastern region were affected by extreme and severe drought conditions. In 2006, northern region was mostly affected by extreme, severe and moderate drought conditions which covered about 31% of area of Bangladesh. Approximately, 29% area was affected by moderate to extreme drought conditions in 2012, where south-western region and central region were suffered by extreme as well as by severe drought, and northern region was suffered by moderate drought. In Rabi season, about 50% of total area was affected by severe and moderate droughts in 1985 and mostly affected area were some part of northern, southern-western, central and eastern regions. In drought condition of 2005 (Figure 8), Dhaka, Satkhira, Bhola, Rangamati and cox’s Bazar and its neighborhood areas were affected by severe and moderate drought. Most of the regions of Bangladesh were affected by different types of drought in 2006 and 2010. In 2012, eastern regions were severely affected, and some area of central region and south-western region were moderately affected by meteorological drought.
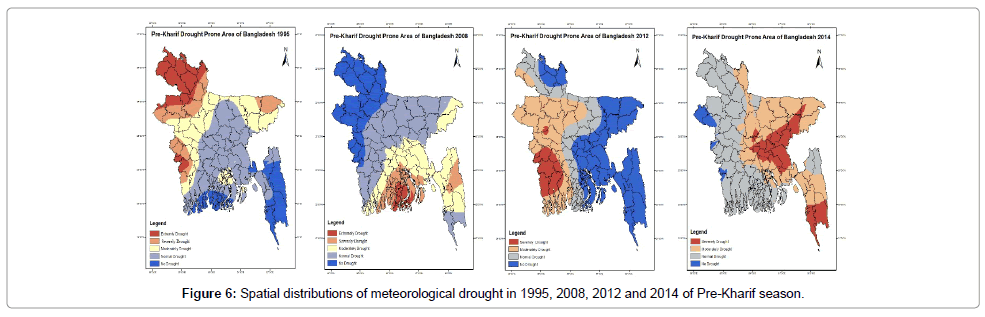
Figure 6: Representative photomicrograph of histopathological features in pulmonary necropsies.
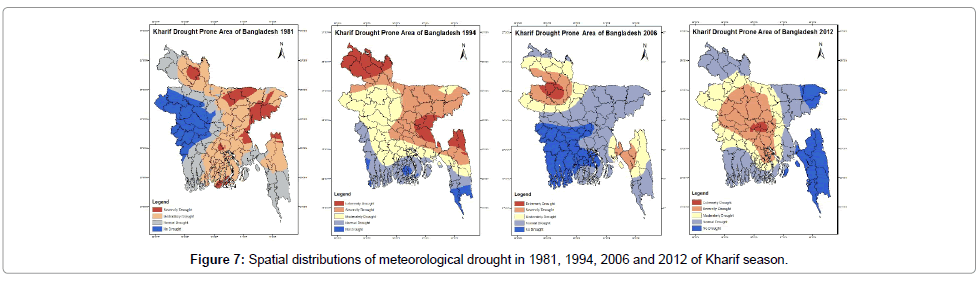
Figure 7: Spatial distributions of meteorological drought in 1981, 1994, 2006 and 2012 of Kharif season.
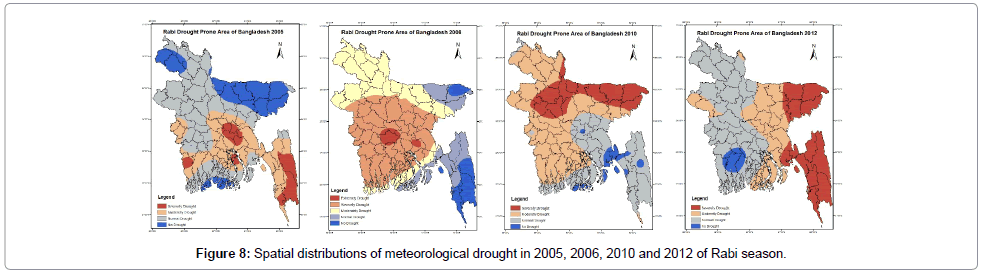
Figure 8: Spatial distributions of meteorological drought in 2005, 2006, 2010 and 2012 of Rabi season.
Conclusion
This study provides a broad knowledge about spatial and temporal variations of meteorological droughts over different regions of Bangladesh during the period 1980-2015. The drought index of the study area was calculated in three different cropping seasons namely Pre-Kharif, Kharif and Rabi. The most significant increasing trend of drought area was found in Rabi season and decreasing trend was found in Kharif season. From the study period, it was found that all drought affected areas were experienced by moderate, severe and extreme droughts in several years of three seasons. In pre-Kharif season, major drought events were found in 1992, 1995, 2007, 2008, 2012 and 2014. The significant drought conditions were found in Kharif season in 1981, 1985, 1992, 1994, 2006 and 2012 and in Rabi season same condition was found in 1985, 1986, 2005, 2006, 2009, 2010 and 2012. In southern and western regions, Jessore, Satkhira, Khulna, Bhola, Barisal and its neighborhood areas; from central regions, Dhaka, Faridpur, Feni, Tangail and its neighborhood areas and from eastern regions, Chittagong, Rangamati hill areas and most of the northern region were more vulnerable to meteorological drought. Major finding of this study is Pre-Kharif and Rabi season were the most vulnerable to meteorological drought which indicates high seasonal rainfall anomaly in most of the regions of Bangladesh. But the terminal drought that occurred in Kharif season (T. Aman) was also responsible for losses of crop yield due to shortage of rainfall. A timely adequate rain showed an increase in the crop yield. Therefore, it is indispensable duty to us to take proper crop managements against extreme conditions of meteorological droughts to increase the crop yield. Meteorological drought simultaneously affects the agricultural productivity, deficit of soil moisture, ground water level and socio-economic problems in a drought affected region. So, agricultural planners and irrigation engineers should take necessary steps to mitigate drought vulnerability based on agro-climatic conditions of Bangladesh.
References
- World Meteorological Organization (2012) Standardized Precipitation Index User Guide (M. Svoboda, M. Hayes and D. Wood, Eds). (WMO-No. 1090), Geneva, Switzerland.
- Ramsey S, Subbia AR, Bass S, Juergens I (2007) Livelihood adaptation to climate variability and change in drought-prone areas of Bangladesh, Asian Disaster Preparedness Center Food and Agriculture Organization of the United Nations.
- Mondol MA, Ara I, Das SC (2017) Meteorological Drought Index Mapping in Bangladesh Using Standardized Precipitation Index during 1981–2010, Advances in Meteorology
- Mondol MA, Das SC, Islam MN (2016) Application of standardized precipitation index to assess meteorological drought in Bangladesh. Journal of Disaster Risk Studies 8: 280
- Shahid S, Behrawan H (2008) Drought risk assessment in the western part of Bangladesh. Natural Hazards 46: 391-413
- Shahid S (2011) Impact of climate change on irrigation water demand of dry season Boro rice in northwest Bangladesh. Climatic Change 105: 433–453
- Karim Z (1996) Agricultural vulnerability and poverty alleviation in Bangladesh. Climate Change and World Food Security, NATO ASI series: Ser. I, Global environmental change 37: 309-346
- Datta AR (2005) Application of Palmer method in analyzing drought in Northwest region of Bangladesh, M.Sc. Engg. Thesis, Department of WRE, BUET, Dhaka
- Shamsuddin S, Behrawan H (2008) Drought risk assessment in the western part of Bangladesh. Natural Hazards 46: 391–413
- McKee T, Doesken N, Kleist J (1993) The relationship of drought frequency and duration to time scales. Preprints, Eight Conferences on Applied Climatology. American Meteorological Society: Anaheim, CA 179–184
- McKee TB, Doesken NJ, Kleist J (1995) Drought monitoring with multiple time scales. Preprints, 9th Conference on Applied Climatology, 15-20 January, American Meteorological Society, Dallas, Texas. pp: 233-236
- Jalpa KS, Parekh F (2014) Drought assessment using standardized precipitation index. Int J Sci Res 3: 1073–1076.
- Niranjan KK, Rajeevan M, Pai DS, Srivastava AK, Preethi B (2013) On the observed variability of monsoon droughts over India. Weather Clim Extremes 1: 42–50
- Naresh KM, Murthy CS, Sai SM, Roy PS (2012) Spatio-temporal analysis of meteorological drought variability in the Indian region using standardized precipitation index. Meteorol Appl 19: 256–264
- Gaikwad Y, Bhosale R (2014) Survey on predictive analysis of drought in India using AVHRR-NOAA remote sensing data. Int J Adv Found Res Comput 1: 1–8.
- Prabhakar SV, Svoboda RK, Shaw M, Sano R, Tsurita I (2011) Defining and monitoring drought using the standardized precipitation index (SPI) in India: An opportunity for climate change adaptation. Int Symp Promoting Synergies among Adaptation Networks in the Asia-Pacific Region, Ibaraki Univ, Mito, Japan.
- Rachchh R, Bhatt N (2014) Monitoring of drought event by standardized precipitation index (SPI) in Rajkot district, Gujarat, India. Int J Eng Dev Res 2: 917–921.
- Vicente-Serrano SM (2012) Performance of drought indices for ecological, agricultural, and hydrological applications. Earth Interact 16: 1–27
- Jahangir AA, Rahman SM, Saadat AH (2013) Monitoring meteorological and agricultural drought dynamics in Barind region Bangladesh using standard precipitation index and Markov chain model. Int J Geomatics Geosci 3: 511–524
- Asadi A, Vahdat SF (2013) The efficiency of meteorological drought indices for drought monitoring and evaluating in Kohgilouye and Boyerahmad Province, Iran. Int J Mod Eng Res 3: 2407–2411
- Golian S, Mazdiyasni O, Kouchak AA (2015) Trends in meteorological and agricultural droughts in Iran. Theor Appl Climatol 119: 679–688
- Thorn HC (1966) Some methods of climatological analysis. WMO Technical Note Number 81, Secretariat of the World Meteorological Organization, Geneva, Switzerland. p: 53
- Press WH, Flannery BP, Teukolsky SA, Vetterling WT (1988) Numerical Recipes in C, The Art of Scientific Computing. Cambridge University Press, Cambridge, England, UK. p: 735
- Yu M, Li Q, Hayes MJ, Svoboda M, Heim RR (2014) Are droughts becoming more frequent or severe in China based on the Standardized Precipitation Evapotranspiration Index: 1951–2010? Drought Mitigation Center Faculty Publications p: 17
- Lu G, Yan G, Wu Z, He H (2010) Analysis on aridification within last 50 years in China. Water Resources and Hydropower Engineering 41: 78-82
Citation: Al-Mamun A, Rahman MNF, Aziz MA, Qayum MA, Hossain MI, et al. (2018) Identification of Meteorological Drought Prone Area in Bangladesh using Standardized Precipitation Index. J Earth Sci Clim Change 9: 457. DOI: 10.4172/2157-7617.1000457
Copyright: © 2018 Al-Mamun A, et al. This is an open-access article distributed under the terms of the Creative Commons Attribution License, which permits unrestricted use, distribution, and reproduction in any medium, provided the original author and source are credited.
Share This Article
Open Access Journals
Article Tools
Article Usage
- Total views: 6400
- [From(publication date): 0-2018 - Apr 25, 2024]
- Breakdown by view type
- HTML page views: 5531
- PDF downloads: 869