Performance Evaluation of Sorghum (Sorghum bicolor (L.) Moench) Genotypes for Grain Yield and Yield Related Traits in Drought Prone Areas of Ethiopia
Received: 06-Feb-2019 / Accepted Date: 20-Mar-2019 / Published Date: 29-Mar-2019 DOI: 10.4172/2329-8863.1000423
Abstract
Sorghum is an indigenous crop of Ethiopia grown in highly diverse environments of having water stress, soil fertility and temperature conditions. Developments of sorghum varieties resistant to drought and producing better grain yield while addressing the plant biomass requirement is one of the strategies in the sorghum breeding program to the dry lowland environment. A total of 22 early maturing sorghum genotypes were evaluated by including one standard check Melkam to estimate the grain yield and stability of performance across the test environments. The trial was conducted using RCBD in row and column arrangement 4. The analysis of variance using additive main effect and multiplicative interaction (AMMI) model revealed significant difference (p<0.01) for genotypes, locations and genotype by location interactions. The two principal components explained 60.4 % further variation due to genotype by location interaction. Based on the overall performance of grain yield, flowering time and plant height and the grain yield stability the variety 2005MI5064 was identified as a potential candidate for production to the target environment. The result also showed that the varieties IESV92084-DL and 2001MS7015 had better grain yield performance and stability across environment, which could be used as potential parental lines for genetic improvement in the sorghum improvement program.
Keywords: Variety; GEI; AMMI; Interaction principal component; Regression coefficient
Introduction
Sorghum (Sorghum bicolor (L.) Moench) is a diploid C4 cereal crop which was domesticated in Africa. It has 2n=20 chromosome and genome size of 750 Mb [1]. Sorghum is predominantly self-pollinated short day plant with the degree of spontaneous cross pollination, in some cases, reaching up to 30%, depending on the shape and type of panicles. It is an indigenous crop of Ethiopia grown in highly diverse environments of having water stress, soil fertility and temperature conditions. In Ethiopia, sorghum grows from the lowland areas which receive lower amount of rainfall and has high temperature to the highland characterized by low temperature and higher amount of rainfall [2]. Sorghum is the fifth major cereal crop in the world and third in Ethiopia which is the most important dry land crop grown by 6 million small holder farmers in more than 1.9 million hectare of land.
Sorghum is considered as major food security crop in Ethiopia which is contributing 18% of the total grain production [3]. Although sorghum is primarily grown in Ethiopia as grain crop, farmers uses its biomass for different purposes which is equally valued as grain. The crop has a wider agro-ecological adaptation, however, is best suited and widely grown in the dry land areas, where water scarcity is limiting for crop production. More than 70% of the area for sorghum production is in Africa and India. USA, India, Mexico, Nigeria, Sudan, and Ethiopia are among the top ranked sorghum producing countries [4]. In Ethiopia sorghum is grown in 1.9 million ha of land and the share of the dry lowland agro ecology is 66%-70% of the total sorghum growing areas. Sorghum in Ethiopian has multiple uses. As the grain is preferred for food the biomass is equally important for farmers to use it as animal feed. Farmers feed their cattle while the plant is the field and store the biomass for the drier season. Hence, variety development considered dual purpose interest both grain and biomass yield.
Sorghum grain has a wide range of nutritional compositions and constituted about 11% water, 340 k/cal of energy, 11.6% protein, 73% carbohydrate and 3% fat by weight [5]. Ethiopia has a wealth of sorghum genetic resources that could be used for increasing productivity and nutritional quality of sorghum. In fact, sorghum is traditionally grown with low adoption rate of improved varieties and production techniques, it has low productivity. The recurrently occurring mainly in the drought prone sorghum growing areas crop failure is becoming eminent every two or three years. The recurrent drought coupling with the lower usage of improved sorghum production technologies increases the vulnerability of sorghum growing farmers in the dry lowlands of Ethiopia. In a recent study it was estimated that poverty level is about 29% of the sorghum growing households [6].
In Ethiopia, drought is usually occurring due to delay in onset, dry spell after sowing, drought during critical crop stage (flowering and grain filling stage) and too early cessation of rain. These situations can be overcome by developing sorghum genotypes which are resistance to moisture stress [7]. Developments of early maturing and drought tolerance varieties containing stay green trait that assist the plant to delay leaf senescence are the major strategies in the national sorghum breeding program of Ethiopia. Genotypes specifically developed for the target environment through crossing of elite materials likely to be tested for their suitability to the moisture stress environments.
Exploitation of genetic variability is the most important tool in plant breeding, and this has to be inferred by phenotypic expression. The consequences of the phenotypic variation depend largely on the environment. This variation is further complicated by the fact that not all genotypes react similar ways to the change in environment. If relative performance of genotypes is different in different environments, then G × E interaction becomes a major challenge to crop improvement. Genotype by environment interaction is the variation, arising from the lack of correspondence between the genetic and non-genetic effects in multi-location trials.
Interactions may involve change in rank order for genotypes between environments and change in the absolute and relative magnitude of the genetic, environmental and phenotypic variances between environments [8]. In general, genotype by environment interactions happen when two or more genotypes perform differently in several environments and are selected as differential genotypic sensitivities to environments. The different response of genotypes across the testing environment is considered as a hindrance in selecting and recommending of crops and cause yield fluctuation [9]. Genotype by environment interaction may offer opportunity for selection and adaptation of genotypes that showed positive interaction with the specific location which helps in the effective utilization of specifically adapted genotypes [10].
Different statistical models are being used to quantify the genotype by environment interactions including the classical analysis of variance (ANVOA), stability and multivariate analysis. The additive, multiplicative interaction component (AMMI) model is a hybrid analysis that incorporates both the additive and multiplicative components of the two-way data structure. In this model the additive portion is separated from interaction by analysis of variance (ANOVA) and the multiplicative component is further decomposed by interaction principal component [11]. Therefore, this study was initiated to know and quantify the magnitude of genotype by environment interaction and identify high yielding, high biomass and stable sorghum genotypes.
Materials and Methods
Description of test environment
The field testing was conducted during the main cropping season of at seven environments of four locations (Kobo, Mieso, Sheraro and Shaorobit ), representing the moister stressed dry lowland areas of Ethiopia located in the altitude range of 1297-1513 m.a.s.l, where sorghum is predominantly frown by small holder farmers crop grown (Table 1).
| Location | Longitude | Latitude | Altitude in m.a.s.l | Soil type | Rain fall in mm | Minimum T° | Maximum T° |
|---|---|---|---|---|---|---|---|
| Kobo | 39°38'E | 12°09'N | 1513 | Vertisol | 678 | 14.8 | 32 |
| Miesso | 39°21'E | 8°30'N | 1470 | Vertisol | 571 | 16 | 31 |
| Sheraro | 39°9'E | 14°6'N | 1179 | Vertisol | 615 | 20.4 | 34 |
| Shoarbite | 39°93'E | 10°35'N | 1500 | Vertisol | 713 | 17.7 | 33 |
Source: National Metrology data of 2016/17 cropping season, m.a.s.l=meters above sea level, T°=Temperature.
Table 1: The agro-ecological characteristics of the experimental locations.
Description of test genotypes
A total of 22 genotypes including one popular released variety Melkam as a standard check evaluated from 2012 to 2014 (Table 2). The genotypes were derived from the pedigree breeding program through crossing of landraces with early maturing elite breeding lines and improved varieties. These genotypes were selected based on their overall field performance and adaptation to the targeted environments. In addition, five genotypes previously introduced from ICRISAT were included in the evaluation.
| Entry # | Genotype | Pedigree | Seed source |
|---|---|---|---|
| 1 | 2001MS7003 | LocalBulk(white)/SRN-39 | Developed by pedigree breeding |
| 2 | 2001MS7013 | PGRC/E#222880/ICSV-1/KAT369-1 | Developed by pedigree breeding |
| 3 | 2001MS7015 | PGRC/E#222880/ICSV-1/KAT369-1 | Developed by pedigree breeding |
| 4 | 2001MS7037 | PGRC/E#222878/ICSV708 | Developed by pedigree breeding |
| 5 | IESV92084-DL | IESV92084-DL | Introduced from ICRISAT |
| 6 | IESV92168-DL | IESV92168-DL | Introduced from ICRISAT |
| 7 | IESV92199-DL | IESV92199-DL | Introduced from ICRISAT |
| 8 | IESV92057-DL | IESV92057-DL | Introduced from ICRISAT |
| 9 | IESV9027-DL | IESV9027-DL | Introduced from ICRISAT |
| 10 | 2001MS7007 | CR:35:5/DJ1195/N13 | Developed by pedigree breeding |
| 11 | 2005MI5060 | WSV387/P9403 | Developed by pedigree breeding |
| 12 | 2005MI5064 | WSV387/P9404 | Developed by pedigree breeding |
| 13 | 2005MI5065 | WSV387/P9405 | Developed by pedigree breeding |
| 14 | 2005MI5066 | M36121/P9401 | Developed by pedigree breeding |
| 15 | 2005MI5069 | M36121/P9402 | Developed by pedigree breeding |
| 16 | 2005MI5070 | M36121/P9403 | Developed by pedigree breeding |
| 17 | 2005MI5075 | 3443-2-OP/P9401 | Developed by pedigree breeding |
| 18 | 2005MI5079 | 3443-2-OP/P9401 | Developed by pedigree breeding |
| 19 | 2005MI5081 | 3443-2-OP/P9403 | Developed by pedigree breeding |
| 20 | 2005MI5082 | 3443-2-OP/P9403 | Developed by pedigree breeding |
| 21 | ICSR24005 | ICSR24005 | Developed by pedigree breeding |
| 22 | Melkam | WSV387 | Check popular released variites |
Table 2: List of sorghum genotypes used for this study and their origin.
Experimental design
The experiment was conducted at Mieso, Sheraro, Shoaroit and. Kobo from 2012 to 2014. Randomized Complete Block Design (RCBD) was used to lay down the genotypes with three replications in a row column arrangement to minimize the special variability in estimating the genetic value. Each plot contained three rows of 5 m length separated by 0.75 m. At all locations sowing was done in between last week of June to first week of July when sufficient rain was received. Plantation was done manually, and population was adjusted by thinning considering 0.15 m as spacing between plants. DAP fertilizer was applied at planting time with the rate of 100 kg/ha and Urea was side dressed when the plant reached at knee height 50 kg/ha basis. Weeding was conducted at least three times during the growing period in each of the test sites depending on the level of weed infection. The following data were collected and analyzed to identify stable and superior genotypes compared the standard check variety.
Days to 50% flowering: The time between days to emergence to 50% of the plants in a plot reached half-bloom stage.
Plant height (cm): The length from the base of the plant to the tip of the panicle.
Grain yield per plot (GY): Grain yield in kilogram of plants from the three rows and adjusted to 10% moisture level and converted to kg ha-1.
Days to 90% physiological maturity (DTM): The number of days from emergence to the stage when 90% of the plants in a plot reached at physiological maturity, i.e., the stage at which when the panicle lose their pigmentation and begin to dry.
Plant aspect (PAS): Over all agronomic desirability score (drought tolerance, earliness, head exertion and compactness, grain size and shape, thresh ability, disease and insect resistance, etc) was measured using 1-5 score where 1=excellent and 5=poor; data scored by the same individual across sites and year were preferably used for this analysis.
Analysis of variance (ANOVA)
The collected grain yield and related data was subjected to Mixed model analysis of variances (ANOVA). R software version 3.4.0 was used.
The locations were considered as random and genotypes as fixed effects. The sources variation were partitioned into blocks, treatments and error terms. The treatment effect further decomposed into three components: G, E and GEI effects. According to Ding et al. [12] the following linear model was used for this experiment.
Yijr=μ+αi+βj+αβij+bj+εijr …………….(1)
Where yijr, is the average value of the dependent variable of genotype i in environment j and block r, μ is a grand mean, αi is the effect of the ith genotype. βj, is the effect of the jth environment, αβij is the effect of the ith genotype by the jth environment, bj is the block effect at the jth environment and ijr ε, is the residual error.
Stability analysis: In this study the following well-known analysis model were used for the stability of analysis.
Eberhart and Russell’s joint regression model: According to Eberhart and Russell [13] model the use of joint linear regression where the yield of each genotype is regressed on the environmental index. The behavior of the genotype was determined by the model:
Yij=μi+βiIj+δij
Where: Yij=the mean performance of the ith genotype in the jth environment, μi=the grand mean of the ith genotype over all the environments, βi=the regression coefficient which measures the response of the ith genotype on environmental index, Ij=the environmental index obtained by the difference between the mean of each environment and the grand mean and δij=the deviation from regression of ith variety in the jth environment.
The additive main effects and multiplicative interaction (AMMI) method: The following AMMI model equation were computed:
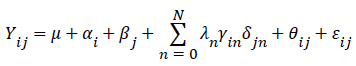
Where, Yij=the mean grain yield of genotype i in environment j, μ=the grand mean, αi=the deviation of the genotype mean from the grand mean, βj=the deviation of the environment mean from the grand mean, λn=the singular value for the IPCA n, N=the number of PCA axis retained in the model, γin=the PCA score of a genotype for PCA axis n, δjn=the environmental PCA score for PCA axis n, θij=the AMMI residual and Eij=the residuals. According to Zobel et al. [11] the degrees of freedom (DF) for the IPCA axis were calculated as DF=G+E-1-2n; Where: G=the number of genotypes, E=the number of environments and n=the nth axis of IPCA.
GGE Biplot Model: GGE biplot were used to have a complete and visual estimation of all features of the data by forming a biplot that simultaneously represents both mean performance and stability, optimized environments for specific genotypes and identifies megaenvironments. According to Yan [14] GGE analysis is partitioned of G +GE into principal components through singular value decomposition of environmentally centered yield data. The following researchers like Tesfaye et al. [15] and Gasura et al. [16] have been used GGE biplot to conduct multi-environment trials and in their finding, they found that the existence of a good testing environment for selecting widely adaptable and high yielding cultivar.
Results and Discussion
Data collected on 21 sorghum genotypes developed by the Ethiopian institute of agricultural research, National sorghum research program including one popular check variety were subjected to analysis of variance (ANOVA) for key characters in order to check the presence of significant difference among genotypes and the results are presented in Tables 3-5. Genotypes and check varieties were tested across seven environments for grain yield and other related traits.
| Source of Variation | Mean Square | ||||
|---|---|---|---|---|---|
| DF | GY | PTH | DTF | PAS | |
| Genotype (Gen) | 21 | 2435941** | 2299.4** | 59.92** | 1.5727** |
| Environment (Env) | 6 | 85824967** | 9769.5** | 869.5** | 20.3579** |
| Gen × Env | 126 | 1128764** | 303.4** | 19.84** | 0.5718** |
| Env × Block | 14 | 1969891** | 558.8* | 61.5** | 0.2132NS |
| Residuals | 294 | 236943447 | 274.7 | 13.74 | 0.1501 |
**=significant probability levels at 1%, * significant=probability levels at 5%, NS=non-significant.
Table 3: Mean squares of combined analysis of variance (ANOVA) of sorghum genotypes evaluated at Miesso, Erer, Kobo, Shoarobite during the main cropping seasons of 2012 to 2014.
| S No | Genotype | Pedigree | Erer | Shewarobit | Kobo | Mieso | Mean | |||
|---|---|---|---|---|---|---|---|---|---|---|
| 2013 | 2014 | 2013 | 2014 | 2014 | 2012 | 2014 | ||||
| 1 | 2001MS7003 | LocalBulk(white)/SRN-39 | 3028 | 2836 | 4432 | 4898 | 3317 | 1961 | 2306 | 3254 |
| 2 | 2001MS7013 | PGRC/E#222880/ICSV-1/KAT369-1 | 2904 | 3071 | 4633 | 4906 | 3802 | 1264 | 1647 | 3175 |
| 3 | 2001MS7015 | PGRC/E#222880/ICSV-1/KAT369-1 | 3658 | 2933 | 6282 | 6004 | 2963 | 2199 | 2399 | 3777 |
| 4 | 2001MS7037 | PGRC/E#222878/ICSV708 | 2924 | 2169 | 3810 | 4148 | 1866 | 1194 | 1558 | 2524 |
| 5 | IESV92084-DL | IESV92084-DL | 3197 | 3230 | 6358 | 6821 | 2768 | 2087 | 2577 | 3863 |
| 6 | IESV92168-DL | IESV92168-DL | 2849 | 2148 | 5865 | 6128 | 1849 | 1972 | 2398 | 3316 |
| 7 | IESV92199-DL | IESV92199-DL | 2785 | 3277 | 4091 | 3481 | 2382 | 2547 | 2360 | 2989 |
| 8 | IESV92057-DL | IESV92057-DL | 2993 | 3378 | 3940 | 4615 | 1977 | 3529 | 2477 | 3273 |
| 9 | IESV9027-DL | IESV9027-DL | 3146 | 1973 | 5230 | 4521 | 3061 | 2779 | 1886 | 3228 |
| 10 | 2001MS7007 | CR:35:5/DJ1195/N13 | 3690 | 3117 | 6157 | 5739 | 2419 | 2095 | 2633 | 3693 |
| 11 | 2005MI5060 | WSV387/P9403 | 3040 | 3647 | 4769 | 4745 | 2497 | 2345 | 2582 | 3375 |
| 12 | 2005MI5064 | WSV387/P9404 | 2630 | 3520 | 5717 | 5180 | 3669 | 3416 | 2345 | 3782 |
| 13 | 2005MI5065 | WSV387/P9405 | 3258 | 3381 | 4839 | 6060 | 3135 | 2631 | 2310 | 3659 |
| 14 | 2005MI5066 | M36121/P9401 | 2997 | 3313 | 4606 | 4913 | 2514 | 2224 | 2522 | 3298 |
| 15 | 2005MI5069 | M36121/P9402 | 2489 | 2581 | 4612 | 4452 | 2757 | 3750 | 2583 | 3318 |
| 16 | 2005MI5070 | M36121/P9403 | 2625 | 4047 | 3488 | 5893 | 1423 | 2421 | 2052 | 3136 |
| 17 | 2005MI5075 | 3443-2-OP/P9401 | 3656 | 3257 | 4104 | 4832 | 2766 | 2019 | 1524 | 3165 |
| 18 | 2005MI5079 | 3443-2-OP/P9401 | 2370 | 2756 | 4548 | 4300 | 2845 | 1979 | 1904 | 2957 |
| 19 | 2005MI5081 | 3443-2-OP/P9403 | 3508 | 2424 | 3791 | 3678 | 2113 | 2093 | 2676 | 2898 |
| 20 | 2005MI5082 | 3443-2-OP/P9403 | 2967 | 4000 | 4702 | 4680 | 1358 | 1828 | 2463 | 3143 |
| 21 | ICSR24005 | ICSR24005 | 2336 | 2785 | 4558 | 4233 | 2137 | 1551 | 2681 | 2898 |
| 22 | Melkam | WSV387 | 2744 | 1911 | 5339 | 5496 | 3356 | 2939 | 3212 | 3571 |
| Mean | 2991 | 2989 | 4812 | 4987 | 2590 | 2310 | 2322 | 3286 | ||
| CV (%) | 16 | 13 | 13 | 8 | 14 | 14 | 11 | |||
| LSD | 765 | 638 | 998 | 694 | 592 | 547 | 403 | |||
Table 4: The combined and mean grain yield (Kg/ha) of early maturing sorghum varieties evaluated from 2012 to 2014 in four different sites.
| S No | Genotype | Pedigree | Erer | Shoarobit | Kobo | Mieso | Mean | |||
|---|---|---|---|---|---|---|---|---|---|---|
| 2013 | 2014 | 2013 | 2014 | 2014 | 2012 | 2014 | ||||
| 1 | 2001MS7003 | LocalBulk(white)/SRN-39 | 154 | 174 | 195 | 181 | 187 | 195 | 165 | 179 |
| 2 | 2001MS7013 | PGRC/E#222880/ICSV-1/KAT369-1 | 138 | 164 | 186 | 189 | 176 | 198 | 170 | 174 |
| 3 | 2001MS7015 | PGRC/E#222880/ICSV-1/KAT369-1 | 142 | 170 | 180 | 182 | 181 | 192 | 187 | 176 |
| 4 | 2001MS7037 | PGRC/E#222878/ICSV708 | 165 | 176 | 215 | 179 | 196 | 193 | 190 | 188 |
| 5 | IESV92084-DL | IESV92084-DL | 149 | 182 | 184 | 192 | 160 | 192 | 185 | 178 |
| 6 | IESV92168-DL | IESV92168-DL | 152 | 193 | 215 | 206 | 182 | 217 | 198 | 195 |
| 7 | IESV92199-DL | IESV92199-DL | 160 | 169 | 207 | 179 | 173 | 193 | 193 | 182 |
| 8 | IESV92057-DL | IESV92057-DL | 148 | 189 | 192 | 188 | 178 | 210 | 185 | 184 |
| 9 | IESV9027-DL | IESV9027-DL | 137 | 160 | 194 | 187 | 170 | 198 | 170 | 174 |
| 10 | 2001MS7007 | CR:35:5/DJ1195/N13 | 155 | 168 | 204 | 170 | 186 | 197 | 170 | 178 |
| 11 | 2005MI5060 | WSV387/P9403 | 160 | 194 | 186 | 168 | 196 | 183 | 207 | 185 |
| 12 | 2005MI5064 | WSV387/P9404 | 178 | 187 | 209 | 179 | 184 | 200 | 202 | 191 |
| 13 | 2005MI5065 | WSV387/P9405 | 195 | 208 | 214 | 197 | 187 | 218 | 200 | 203 |
| 14 | 2005MI5066 | M36121/P9401 | 180 | 180 | 219 | 198 | 187 | 197 | 198 | 194 |
| 15 | 2005MI5069 | M36121/P9402 | 164 | 185 | 182 | 178 | 188 | 217 | 195 | 187 |
| 16 | 2005MI5070 | M36121/P9403 | 167 | 183 | 205 | 189 | 184 | 198 | 195 | 189 |
| 17 | 2005MI5075 | 3443-2-OP/P9401 | 214 | 193 | 233 | 185 | 197 | 242 | 193 | 208 |
| 18 | 2005MI5079 | 3443-2-OP/P9401 | 137 | 182 | 167 | 183 | 187 | 170 | 187 | 173 |
| 19 | 2005MI5081 | 3443-2-OP/P9403 | 152 | 174 | 184 | 175 | 178 | 180 | 188 | 176 |
| 20 | 2005MI5082 | 3443-2-OP/P9403 | 140 | 183 | 188 | 179 | 180 | 178 | 188 | 177 |
| 21 | ICSR24005 | ICSR24005 | 159 | 183 | 184 | 188 | 181 | 208 | 192 | 185 |
| 22 | Melkam | WSV387 | 117 | 144 | 184 | 174 | 150 | 188 | 170 | 161 |
| Mean | 157 | 179 | 197 | 184 | 181 | 198 | 188 | 183 | ||
| CV (%) | 8 | 8 | 13 | 7 | 8 | 10 | 9 | |||
| LSD | 27 | 23 | ns | ns | 23 | 34 | ns | |||
Table 5: Combined and mean plant height of the test genotypes evaluated in each of the test sites from 2012 to 2014.
Analysis of variance across test environment
Combined analysis of variance (ANOVA) across locations for grain yield (GY), days to flowering (DTF), plant height (PTH) and overall agronomic desirability (PAS) revealed highly significant variability among the genotypes with significant environment, and genotype by environment interaction effect (Table 3). The high mean square values for locations across the test environments indicating that the test genotypes responded differently across environments. Hence, decision on selecting genotypes need to consider the target environments. Similar findings have been reported by Assefaw [17] and Gasura et al. [16] on multi-environment evaluation of sorghum genotypes.
Mean performance of advanced early maturing sorghum varieties
The mean performance of the 22 genotypes including one standard check (Melkam) for grain yield, days to flowering, plant height, days to maturity and overall agronomic desirability performance at dry lowland representative testing sites (Miesso, Erer, Shoarobite and Kobo) are given in Table 4. In the current research finding high significant effect of genotypes for Grain yield (kg/ha), Plant height (cm) and Days to flowering, Days to maturity and overall agronomic desirability was observed which is in agreement with the findings of many researchers [18-23]. The mean grain yield of the test genotypes across environment was 3286 kg/ha with the range between 2524 to 3863 kg/ha. In comparison to the improved standard check variety (Melkam) six of the tested varieties gave the highest mean grain yield advantage ranged between 2 to 8% (Table 4).
The variety IESV92084-DL gave the highest mean grain yield (3863 kg/ha) across all the environments. The highest mean grain yield performance was obtained at Shoarobit which 4987 kg/ha for 2014 and 4812 kg/ha for 2013 crop season, while the lowest mean grain yield (2310 kg/ha) was obtained in 2012 at Mieso. This showed the seasonal variability which has been affected the variation in genetic performance of the test genotypes.
Based on over all agronomic desirability score (PAS) two promising genotypes 2005MI5064 and 2005MI5065 with the pedigree of WSV387XP9404 and WSV387XP9405 respectively have been identified for verification trial and these genotypes super imposed on three on station and 6 on farm and later, after national variety release committee (NVRC) evaluated their field performance the variety 2005MI5064 has been released for commercial production. The released variety 2005MI5064 is mainly preferred for tall plant height (which is the number one criterion of farmers in dry lowland sorghum growing areas), excellent head exertion (the line has an exertion of about 7 cm between ligule of flag leaf to head base) compared to head base almost entirely covered by leaf sheath in the recent released varieties (Dekeba and Melkam), semi compact head, high and stable yield.
The released variety 2005MI5065 (WSV387XP9405) is preferred mainly for tall plant height having a plant height advantage of 23.7%, head exertion and compactness but this candidate genotype was not accepted by the national variety release committee. Generally, the released candidate variety 2005MI5064 is preferred mainly for tall plant height having a plant height (190.79 cm) advantage of 16.7%, head exertion and compactness but it also has grain yield (3810.96 kg/ha) advantage of 7% over the standard check Melkam.
As plant biomass is an important attribute to sorghum growing farmers, the test genotypes were evaluated for plant height. Plant height had the highest heritability across environments (87%) indicating the repeatability of the genotype’s performance in plant height across the testing sites. The mean plant height across environment was 183 cm with the range of 161 to 208 cm (Tables 4 and 6). All the test genotypes had the highest mean plant height, however, two of the test varieties (2005MI5075 and 2005MI5065) had mean plant height greater than 200 cm. As a measure of adaptation to the target environment the test genotypes were compared for flowering time with the check variety. Hence, seven of the tested genotypes had similarity in flowering time with the check variety Melkam. This result indicating that these varieties could adapted to the environment where can adapt and perform.
| Genotype | BLUP_DTF | BLUE_DTF | BLUP_DTM | BLUE_DTM | BLUP_PTH | BLUE_PTH | BLUP_GY | BLUE_GY | BLUP_PAS | BLUE_PAS |
|---|---|---|---|---|---|---|---|---|---|---|
| 2001MS7003 | 77.88 | 78.2 | 121.24 | 121.22 | 179.77 | 179.36 | 3265.73 | 3253.97 | 3.28 | 3.29 |
| 2001MS7007 | 76.22 | 75.73 | 121.9 | 122.11 | 178.95 | 178.41 | 3498.66 | 3688.04 | 3.56 | 3.71 |
| 2001MS7013 | 78.24 | 78.73 | 121.81 | 122 | 174.99 | 173.85 | 3223.46 | 3175.21 | 3.39 | 3.46 |
| 2001MS7015 | 77.93 | 78.27 | 123.05 | 123.67 | 174.64 | 173.45 | 3546.24 | 3776.71 | 3.25 | 3.25 |
| 2001MS7037 | 79.59 | 80.73 | 123.37 | 124.11 | 187.15 | 187.84 | 2874.08 | 2524.13 | 3.53 | 3.67 |
| 2005MI5060 | 78.06 | 78.47 | 121.07 | 121 | 182.42 | 182.4 | 3330.77 | 3375.18 | 3.28 | 3.29 |
| 2005MI5064 | 77.88 | 78.2 | 121.32 | 121.33 | 189.71 | 190.79 | 3564.62 | 3810.96 | 2.79 | 2.58 |
| 2005MI5065 | 75.99 | 75.4 | 121.57 | 121.67 | 200.9 | 203.66 | 3426.91 | 3554.34 | 2.73 | 2.5 |
| 2005MI5066 | 77.61 | 77.8 | 120.5 | 120.22 | 193.27 | 194.88 | 3325.3 | 3364.99 | 2.9 | 2.75 |
| 2005MI5069 | 77.61 | 77.8 | 121.32 | 121.33 | 184.46 | 184.75 | 3299.94 | 3317.73 | 2.84 | 2.67 |
| 2005MI5070 | 77.88 | 78.2 | 122.96 | 123.56 | 186.65 | 187.27 | 3202.27 | 3135.73 | 3.19 | 3.17 |
| 2005MI5075 | 78.24 | 78.73 | 123.21 | 123.89 | 204.21 | 207.46 | 3215.67 | 3160.69 | 3.39 | 3.46 |
| 2005MI5079 | 75.05 | 74 | 119.84 | 119.33 | 173.91 | 172.61 | 3121.91 | 2985.97 | 3.59 | 3.75 |
| 2005MI5081 | 79.73 | 80.93 | 122.06 | 122.33 | 175.46 | 174.41 | 3059.21 | 2869.13 | 3.28 | 3.29 |
| 2005MI5082 | 78.65 | 79.33 | 123.13 | 123.78 | 177.09 | 176.27 | 3205.99 | 3142.64 | 3.42 | 3.5 |
| ICSR24005 | 76.22 | 75.73 | 120.99 | 120.89 | 183.47 | 183.6 | 3074.48 | 2897.58 | 3.73 | 3.96 |
| IESV9027-DL | 74.83 | 73.67 | 118.94 | 118.11 | 175.45 | 174.38 | 3264.57 | 3251.81 | 3.25 | 3.25 |
| IESV92057-DL | 74.96 | 73.87 | 118.53 | 117.56 | 183.92 | 184.12 | 3265.55 | 3253.65 | 3.45 | 3.54 |
| IESV92084-DL | 77.43 | 77.53 | 120.25 | 119.89 | 176.62 | 175.74 | 3592.29 | 3862.54 | 3.05 | 2.96 |
| IESV92168-DL | 76.17 | 75.67 | 119.84 | 119.33 | 189.95 | 191.06 | 3301.39 | 3320.42 | 3.33 | 3.38 |
| IESV92199-DL | 77.57 | 77.73 | 121.81 | 122 | 179.71 | 179.28 | 3050.59 | 2853.06 | 3.13 | 3.08 |
| Melkam | 75.18 | 74.2 | 119.51 | 118.89 | 163.15 | 160.24 | 3435.84 | 3570.98 | 2.9 | 2.75 |
BLUP=Best Linear Unbiased Predictor, BLUE=Best Linear Unbiased Estimator, DTF=Days to Flowering, PTH=Plant Height (cm), DTM=Days to Maturity, GY=Grain Yield (Kg/ha), PAS=Overall Agronomic Desirability.
Table 6: Combined Meta-R (Multi Environment trial analysis) of sorghum genotypes evaluated across seven environment.
Combined ANOVA determines if GEI is a significant source of variation or not and estimates it but does not provide insight into the patterns of genotypes or environments that give rise to the interaction [24]. Therefore, the combined data was also analyzed using AMMI model that further partitions GEI into interaction principal component axis (IPCA) components. Hence, the AMMI model analysis had partitioned the GEI into the first two significant IPCAs. AMMI ANOVA given in Table 7.
| Source of variation | SS | DF | MS | % of sum of square |
|---|---|---|---|---|
| Environment | 514949802.3 | 6 | 85824967.05** | 72.7 |
| Genotype | 51154766.16 | 21 | 2435941.25** | 7.22 |
| Interaction | 142224244 | 126 | 1128763.85** | 20.08 |
| IPC1 | 48723428.72 | 26 | 1873978.03** | 34.3 |
| IPC2 | 37083643.86 | 24 | 1545151.83** | 26.1 |
| IPC3 | 22908132.9 | 22 | 1041278.77ns | 16.11 |
| IPC4 | 18189841.35 | 20 | 909492.07ns | 12.79 |
| IPC5 | 8621549.17 | 18 | 478974.95ns | 6.06 |
| IPC6 | 6697648 | 16 | 418603.00ns | 4.71 |
| Residuals | 264521915.1 | 308 | 858837.39 | - |
IPCA1=Interaction Principal Component Analysis 1, IPCA2=Interaction Principal Component Analysis 2, IPCA3=Interaction Principal Component Analysis 3, ns=non-significant and **Significant at p ≤ 0.01, respectively.
Table 7: AMMI model analysis of variance for grain yield of sorghum genotypes in seven environments of four locations.
Additionally, Eberhart and Russel regression model used to see the stability performance of the tested genotypes (Table 8).
| Genotypes | Mean | Sd | Bi | S2di | R2 |
|---|---|---|---|---|---|
| 2001MS7003 | 3253.97 | 1071.59 | 0.89 | -125205.68 | 0.9 |
| 2001MS7007 | 3688.04 | 1631.71 | 1.4 | -139595.78 | 0.96 |
| 2001MS7013 | 3175.21 | 1389.89 | 1.05 | 328825.84 | 0.74 |
| 2001MS7015 | 3776.71 | 1683.87 | 1.46 | -184471.93 | 0.98 |
| 2001MS7037 | 2524.13 | 1133.71 | 0.95 | -137321.8 | 0.91 |
| 2005MI5060 | 3375.18 | 1038.17 | 0.88 | -177247.55 | 0.93 |
| 2005MI5064 | 3810.96 | 1237.84 | 0.95 | 0.16899 | 0.76 |
| 2005MI5065 | 3554.34 | 1407.08 | 1.19 | -0.87684 | 0.92 |
| 2005MI5066 | 3364.99 | 1038.37 | 0.89 | -212348.91 | 0.96 |
| 2005MI5069 | 3317.73 | 933.97 | 0.65 | 115588.72 | 0.63 |
| 2005MI5070 | 3135.73 | 1496.56 | 1.03 | 776775.09 | 0.61 |
| 2005MI5075 | 3160.69 | 1159.68 | 0.91 | 58601.15 | 0.8 |
| 2005MI5079 | 2985.97 | 1063.47 | 0.88 | -120758.17 | 0.89 |
| 2005MI5081 | 2869.13 | 781.47 | 0.56 | -22779.32 | 0.66 |
| 2005MI5082 | 3142.64 | 1349.84 | 1.02 | 303822.83 | 0.74 |
| ICSR24005 | 2897.58 | 1103.66 | 0.91 | -86996.54 | 0.88 |
| IESV9027-DL | 3251.81 | 1244.11 | 0.96 | 141069.9 | 0.78 |
| IESV92057-DL | 3253.65 | 889.63 | 0.61 | 91525.29 | 0.62 |
| IESV92084-DL | 3862.54 | 1907.27 | 1.67 | -232439.09 | 0.99 |
| IESV92168-DL | 3320.42 | 1868.99 | 1.6 | -74349.5 | 0.95 |
| IESV92199-DL | 2853.06 | 679.83 | 0.54 | -175548.31 | 0.83 |
| Melkam | 3570.98 | 1344.39 | 1.01 | 299244.77 | 0.74 |
Table 8: Regression coefficient (bi) and standard deviation from linearity of regression (S2di) for the test genotypes using Eberhart and Russell model.
Stability analysis across the testing sites
The combined analysis showed the significant genotype by environment interaction, which would have effect in the ranking of genotypes in each of the testing sites. AMMI model has been used to further partitions GEI into interaction principal component axis (IPCA) components and assess stability of the test genotype across locations. The AMMI analysis of variance for the (additive main effect) showed significant difference (p ≤ 0.01) for the testing locations, genotypes and genotype by location interaction (Table 7).
The result showed that the environment accounted the maximum sum of square 72.70% followed by the genotype by environment interaction sum of square (20.08%) and the genotype sum of square was found to be the lowest (7.22%). The larger proportion of variance caused by the significant variation of the test environment in soil characteristics and availability of moisture. The first principal component (IPCA1) captured 34.3% of the total variation while the second principal component explained 26.1% of the variation, which add up to 60.4 of the total variation. The most reliable model for AMMI can be estimated using the first two IPCAs and illustrated that most of the interaction occurs in the first few axes.
The graphical presentation of grain yield plotted against the IPC 1 grouped the test environments and genotypes based on the effect to the environment interaction (Figure 1). From the seven test environments the trial conducted at Sherarao (SR) on both 2013 and 2014 were distinctly grouped while the other five environments closely grouped together (Figure 1). This study have shown that the closeness between pairs of locations or pairs of genotypes in the biplot is proportional to their similarity for genotype by location interaction effects. This suggested that environments that have similar genotype by environment interaction effect can be combined to identify genotypes suitable to the targeted environment.

Figure 1: AMMI biplot for grain yield of 22 sorghum genotypes evaluated in seven environments. GYLD (Grain yield)- Y-axis plotted against the first IPCA1; The roman number represented genotype number and environments designated by MS12=Miesso in 2012, ER13=Erer in 2013,SR13=Shoaarobit in 2013, MS14=Miesso in 2014, KB14=Kobo in 2014, ER14=Erer in 2014 and SR14= Shoaarobit in 2014.
The interaction principal component 1 (IPCA1) plotted in the x-axis and the interaction principal component two (IPCA2) plotted in the yaxis (Figure 2) showed that the first Interaction Principal Component (IPC1) explained 34.3% while the second interaction principal component explained 26.1% the two interaction principal components with a cumulative effect of 64.4% of the genotype by environment interaction effect.

Figure 2: AMMI biplot for grain yield of 22 sorghum genotypes evaluated in seven environments. This Biplot showing genotypes grain yield stability and preferential adaptation environment using the first two IPCAs. The roman number represented tested genotype and environments designated by MS12=Miesso in 2012, ER13=Erer in 2013, SR13=Shoarobite in 2013, MS14=Miesso in 2014, KB14= Kobo in 2014, ER14=Erer in 2014 and SR14=in 2014.
Genotypes plotted to the center are considered to be stable across the test environments. Hence, genotypes 2001MS7003, 2001MS7037 and ICSR24005 were found to be the most stable across environments. In addition, the best performing sorghum genotypes across environments (2005MI5064 and 2005MI5065) were also had better stability.
Analysis based on Eberhart and Russel regression model
The Ebrehart and Russell [13] analysis model revealed that two of the test genotypes (2005MI5064 and 2005MI5065) that had better grain yield performance from the standard check (3811 and 3554) respectively, and they had regression coefficients approaching one (0.9476 and 1.186) in the same order and acceptable deviation from regression (-0.168, and -0.876) respectively, suggesting that these genotypes are stable and widely adaptable than the other genotypes (Table 7). An ideal genotype has the highest average grain yield, a regression coefficient (bi) value of approximately one and a mean square deviation from regression (s2di) value close to zero [13,25,26].
Conclusion
Combined analysis of variance displayed highly significant GXE interaction, which is a major challenge in the course of variety development and release activities. Besides, variations were significant among the test sites. Selecting genotypes in diversified testing locations and assessing yield stability of early maturing sorghum genotypes is quite vital. The AMMI analysis for the additive main effect and multiplicative interaction effect reveled significant difference for Genotype, testing location and genotype by testing location interaction. The first interaction principal component (IPCA 1) captured major part of the interaction 34.3 and the second interaction principal component explained additional 26.1 and both together explained 60.4% of the genotype by environment.
Based on the all agronomic desirability score two promising candidate genotypes 2005MI5064 and 2005MI5065 with the pedigree of WSV387XP9404 and WSV387XP9405 respectively have been identified for verification trial and these genotypes super imposed on three on station and 6 on farm and then their performance evaluated by the national variety release committee (NVRC) and the first candidate genotype called 2005MI5064 verified in 2016 for commercial production for dry lowland sorghum growing areas.
The candidate variety 2005MI5065 (WSV387XP9405) is preferred mainly for tall plant height having a plant height advantage of 23.7%, head exertion and compactness but this candidate genotype was not accepted by the national variety release committee. The variety 2005MI5064 is preferred mainly for tall plant height having a plant height (190.79 cm) advantage of 16.7%, head exertion and compactness but it also has grain yield (3810.96 kg/ha) advantage of 7% over the standard check Melkam.
References
- Paterson AH, Bowers JE, Bruggmann R, Dubchak I, Grimwood J, et al. (2009) The Sorghum bicolor genome and the diversification of grasses. Nature 457: 551.
- Mindaye TT, Mace ES, Godwin ID, Jordan DR (2016) Heterosis in locally adapted sorghum genotypes and potential of hybrids for increased productivity in contrasting environments in Ethiopia. The Crop Journal 4: 479-489.
- Central Statistical Agency of Ethiopia (CSA) (2017) Agricultural Sample Survey 2016/2017. Stat Bull p: 584.
- Rakshit S, Hariprasanna K, Gomashe S, Ganapathy KN, Das IK, et al. (2014) Changes in area, yield gains, and yield stability of sorghum in major sorghum-producing countries, 1970 to 2009. Crop Sci 54: 1571-1584.
- Hiebsch C, O’Hair SK (1986) Major domesticated crops In: Hansen A and DE McMillan. Food in Sub-Saharan Africa pp: 177-206.
- Alberts MJ (2004) A comparison of statistical methods to describe genotype x environment interaction and yield stability in multi-location maize trials (Doctoral dissertation, University of the Free State).
- Belay F, Meresa H (2017) Performance evaluation of sorghum [Sorghum bicolor (L.) Moench] hybrids in the moisture stress conditions of Abergelle District, Northern Ethiopia. J Cereals Oilseeds 8: 26-32.
- Bowman JC (1972) Genotype× environment interactions. In Annales De Génétique Et De Sélection Animale 4: 117.
- Kang MS (1997) Using genotype-by-environment interaction for crop cultivar development. In Advances in Agronomy 62: 199-252.
- Ceccarelli S, Grando S (2007) Decentralized-participatory plant breeding: An example of demand driven research. Euphytica 155: 349-360.
- Zobel RW, Wright MJ, Gauch HG (1988) Statistical analysis of a yield trial. Agronomy J 80: 388-393.
- Ding M, Tier B, Yan W (2007) Application of GGE biplot analysis to evaluate genotype environment and GxE interaction on P. radiata: A Case Study 2: 1.
- Everhart SA (1966) Stability parameters for comparing varieties. Crop Sci 6: 36-40.
- Yan W (2001) GGEbiplot-a Windows application for graphical analysis of multi environment trial data and other types of two-way data. Agronomy J 93: 1111-1118.
- Letta T, Egidio DMG, Abinasa M (2008) Analysis of multi-environment yield trials in durum wheat based on GGE-biplot. JFAE 6: 217.
- Gasura E, Setimela PS, Souta CM (2015) Evaluation of the performance of sorghum genotypes using GGE biplot. Can J Plant Sci 95: 1205-1214.
- Adugna A (2007) Assessment of yield stability in sorghum. African Crop Science Journal 15: 83.
- Taye T (2006) Combining ability of Sorghum (Sorghum bicolor (L.) Moench) lines for drought tolerance. MSc Thesis, School of Graduate Studies, Haramaya University, Ethiopia.
- Ayana A, Mengistu G (2006) Heterosis and combining ability in Ethiopian Sorghum (Sorghum bicolor (L.) Moench) Landraces (Doctoral Dissertation, Haramaya University).
- Wegary D, Vivek BS, Tadesse B, Abdissa K, Worku M, et al. (2011) Combining ability and heterotic relationships between CIMMYT and Ethiopian maize inbred lines. EJAS 21: 82-93.
- Zerihun T (2011) Genotype x Environment interaction and yield stability analysis of maize (Zea mays L.) in Ethiopia. MSc Thesis, School of Graduate Studies, Jimma University, Ethiopia.
- Al-Emnesh A (2012) Test cross performance and combining ability studies of elite maize (Zea mays L.) inbred lines in the central rift valley of Ethiopia (Doctoral Dissertation, MSc Thesis, School of Graduate Studies, Jimma University, Ethiopia).
- Nigus B (2012) Combining ability and heterotic grouping of elite maize (Zea mays L.) inbred lines in the central rift valley of Ethiopia. MSc Thesis, School of Graduate Studies, Jimma University, Ethiopia.
- Samonte SOP, Wilson LT, McClung AM, Medley JC (2005) Targeting cultivars onto rice growing environments using AMMI and SREG GGE biplot analyses. Crop Science 45: 2414-2424.
- Becker HC, Leon J (1988) Stability analysis in plant breeding. Plant Breeding 101: 1-23.
- Gauch HG, Zobel RW (1988) Predictive and postdictive success of statistical analyses of yield trials. Theoretical and Applied Genetics 76: 1-10.
Citation: Seyoum A, Gebreyohannes A, Nega A, Nida H, Tadesse T, et al. (2019) Performance Evaluation of Sorghum (Sorghum bicolor (L.) Moench) Genotypes for Grain Yield and Yield Related Traits in Drought Prone Areas of Ethiopia. Adv Crop Sci Tech 7: 423. DOI: 10.4172/2329-8863.1000423
Copyright: © 2019 Seyoum A, et al. This is an open-access article distributed under the terms of the Creative Commons Attribution License, which permits unrestricted use, distribution, and reproduction in any medium, provided the original author and source are credited.
Share This Article
Open Access Journals
Article Tools
Article Usage
- Total views: 3680
- [From(publication date): 0-2019 - Apr 24, 2024]
- Breakdown by view type
- HTML page views: 2756
- PDF downloads: 924