Proposal for Insulinogenic Index (IGI)-Carbo70 as Experimental Evaluation for Diabetes
Received: 09-Oct-2017 / Accepted Date: 11-Oct-2017 / Published Date: 18-Nov-2017
Abstract
Background: The discussion has continued concerning Calorie Restriction (CR) and Low Carbohydrate Diet (LCD) for years. Authors and colleagues have continued clinical research on LCD. In this study, CR diet was given to diabetic patients and the new evaluation way of insulinogenic index-carbohydrate 70 g (IGI-carbo70) would be proposed.
Subjects and methods: The subjects were 48 patients with Type 2 diabetes mellitus (T2DM) and admitted for 14 days for further evaluation and treatment. CR diet was provided on day 1 and 2, including 60% carbohydrate, 25% lipids and 15% protein with 1400 kcal/day. On the morning of day 2, breakfast with 70 g of carbohydrate was given, and blood glucose and immune reactive insulin (IRI) at 0 and 30 min and IGI were investigated.
Results: Average HbA1c was 7.9% and Morbus (M) value was 108 in median. Glucose and IRI on 0-30 min significantly increased as 166-212 mg/dL, 4.3-1.9 μU/mL, respectively. Classified into 3 groups as to HbA1c level, low, middle and high group showed HbA1c 6.0%, 7.8%, 9.7%, respectively. Glucose and IRI on 0-30 min in median were 117-50, 166-203, 218-299 mg/dL, 4.4-12.8, 4.5-13.5, 4.2-9.9 μU/mL, with IGI 0.25, 0.14, 0.10, respectively.
Discussion and conclusion: Newly-proposed IGI-carbo70 was investigated, and there were several correlations among 8 related biomarkers. These findings suggest that current results would become the fundamental data and IGIcarbo70 could be the useful way to evaluate diabetic status by usual meal with mixed nutrients.
Keywords: (IGI-carbo70) Insulinogenic index-carbohydarate 70 g; (CR) Calorie restriction; (LCD) Low carbohydrate diet; (T2DM) Type 2 diabetes mellitus; (IRI) Immunoreactive insulin
Abbreviations
IGI-carbo70: Insulinogenic Index-Carbohydarate 70 g; CR: Calorie Restriction; LCD: Low Carbohydrate Diet; T2DM: Type 2 Diabetes Mellitus; M value: Morbus value; MAGE: Mean Amplitude of Glycemic Excursions; IRI: Immunoreactive Insulin; VLCKD: Very Low-Carbohydrate Ketogenic Diet; CGM: Continuous Glucose Monitoring; HOMA-R: Homeostasis Model Assessment-Insulin Resistance; HOMA-β: Homeostasis Model Assessment of β-cell Function; HDL-C: High density Lipoprotein Cholesterol; LDL-C: Low Density Lipoprotein Cholesterol; 75 g OGTT: 75 g Oral Glucose Tolerance Test
Introduction
The discussion has continued concerning Calorie Restriction (CR) and Low Carbohydrate Diet (LCD) for years [1-5]. Clinical predominance of LCD has been gradually known and more prevalent. In European and North American region, Atkins and Bernstein originally have begun to introduce LCD [6,7].
On contrast in Japan, the authors have started LCD, and reported thousands of cases with clinical efficacy [8,9]. Furthermore, we have investigated related research concerning 3 types of LCD formular meals, elevated ketone bodies, Morbus (M) value, lipid metabolism and renal function [10-12].
Through our clinical study, we always compared the differences of the glucose variability between CR and LCD. In this study, we have given CR diet to the patients with type 2 diabetes mellitus (T2DM), and investigated the responses of blood glucose, immunoreactive insulin (IRI) value and insulinogenic index (IGI), suggesting the usefulness of experimental application of IGI as an approach for clinical study.
Methods
The subjects enrolled in this study were 48 patients (M/F 23/25) with T2DM. They are 18-84 years old with 59.4 ± 12.9 (mean ± SD) years old in average, 60.5 years old in median value.
Subjects were admitted for 14 days for further evaluation and treatment of T2DM. The protocol of diet therapy was as follows: 1) Calorie Restriction (CR) diet was provided on days 1 and 2, which had 60% carbohydrate, 25% lipids and 15% protein with 1400 kcal/day. 2) Low Carbohydrate Diet (LCD) was provided from 3 to 14 days, which had 12% carbohydrates, 64% lipids and 24% protein with 1400 kcal/ day. This LCD has been so-called “super-LCD formula” in our clinical research for LCD, which is one of the very low-carbohydrate ketogenic diet (VLCKD) by the definitions of LCD [12-14].
Methods included the measurements of responses for glucose and IRI against 70 g of carbohydrate on the morning of day 2. CR diet has 840 kcal of carbohydrate per day, which equals totally 210 g of carbohydrate in 3 meals. Then, breakfast including 70 g of carbohydrate was given to the patients after overnight fasting, with the measurement of blood glucose and IRI on 0 min and 30 min. Other blood biomarkers were measured in fasting on day 2.
The content of CR diet is along the guideline of Japan Diabetes Society, in which PFC ratio is 14.7%, 26.9%, 58.4%, respectively [15]. This ratio has been stable from 1985 to 2015 on the national survey in Japan [16].
Glucose profile and M value
On day 2, daily profile of blood glucose was studied 7 times a day, which are 8, 10, 12, 14, 17, 19, 22 h. According to the glucose level, 2 markers were calculated. One is the average glucose level, and another is Morbus (M) value. M value is a useful index representing both blood sugar level and mean amplitude of glycemic excursions (MAGE) [17- 19]. As for the glucose variability, daily profiles of blood glucose were measured 7 times a day, and obtained data were calculated for average glucose level and Morbus (M) value. M value has been proposed for researching MAGE. This index has been calculated as a logarithmic transformation of the deviation of glycemia from an arbitrary assigned “ideal” glucose value, with an expression of both the mean glucose value and the effect of glucose swings [17-20].
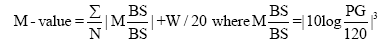
M value is calculated by the formula as follows: M=MBS+MW, where MW=(maximum blood glucose-minimum glucose)/20; MBS=the mean of MBSBS; MBSBS=individual M-value for each blood glucose value calculated as (absolute value of [10×log (blood glucose value/120)])3.
As to the interpretation of M value, the standard range is <180, borderline is 180-320 and abnormal is >320. Adequate sampling times a day have been argued for the detail and precise evaluation of glucose variability and MAGE. There were similar results on 7 times or 20 times of sampling per day [17-21] showing similar result in comparison with continuous glucose monitoring (CGM) [19-22].
Statistical analyses
In this study, obtained data was represented as the mean ± standard deviation (SD) and also represented median, quartile of 25% and 75% in biomarkers. For statistical analyses, correlation coefficients were calculated using Pearson or Spearman test of the Microsoft Excel analytical tool, which is Four steps Excel Statistics 4th edition [23].
Intergroup comparisons were made using the Wilcoxon rank sum test or the Bonferroni multiple comparison (Lambert method). A significance level of less than 5% obtained using a two-tailed test was considered to be statistically significant.
Ethical considerations
Current study was conducted in compliance with the ethical principles of the Declaration of Helsinki and Japan’s Act on the Protection of Personal Information along with the Ministerial Ordinance on Good Clinical Practice (GCP) for Drug (Ordinance of Ministry of Health and Welfare No. 28 of March 27, 1997). No ethical committee meeting was held. Informed consent was obtained from the subjects. The study was registered with UMIN #R000031211.
Results
Basal data
The basal data of 48 patients enrolled were shown in Table 1. The values are expressed by average, standard deviation and median (25%- 75%). The average age was 59.4 years old, and average HbA1c was 7.9%. M value obtained from the daily profile of glucose on day 2 was 108 34.1-308 median 25%-75%.
| Mean ± SD | Median | 25%-75% | |
|---|---|---|---|
| Age (years old) | 59.4 ± 12.9 | 60.5 | 54.5-68.3 |
| HbA1c (%) | 7.9 ± 1.7 | 8.1 | 6.4 - 8.9 |
| Average Glucose (mg/dL) | 196.3 ± 81.3 | 174.3 | 147-241 |
| Morbus Value | 207.3 ± 258 | 108 | 34.1-308 |
| Triglyceride (mg/dL) | 184.4 ± 239 | 101.5 | 70.8 -202 |
| HDL-C (mg/dL) | 66.8 ± 20.5 | 63.5 | 10.0-79.8 |
| LDL-C (mg/dL) | 140.4 ± 43.9 | 138.5 | 109-165 |
| HOMA-R | 2.0 ± 1.1 | 1.9 | 1.1-2.5 |
| HOMA-β | 21.6 ± 17.6 | 16.7 | 10.6-25.7 |
Table 1: Basal Data of Patient with T2DM.
Carbohydrate loading
Biomarkers data related to 70 g of carbohydrate intake were shown in Table 2. The values are expressed by the average, standard deviation, median and quartile of 25% and 75%. Responses of glucose and IRI against 70 g of carbohydrate were shown in Figure 1. Number of the subjects is 48. There was significant difference between glucose increase at 0 and 30 minutes, and between IRI increase at 0 and 30 minutes (p<0.01).
| Mean ± SD | Median | 25%-75% | |
|---|---|---|---|
| Glucose 0 min (mg/dL) | 169.1 ± 54.1 | 166 | 124-212 |
| Glucose 30 min (mg/dL) | 215.3 ± 64.1 | 212 | 160-269 |
| IRI 0 min (µU/mL) | 4.8 ± 2.2 | 4.3 | 3.0-6.2 |
| IRI 30 min (µU/mL) | 13.6 ± 9.8 | 11.9 | 7.8-18.0 |
| Glucose Increase (mg/dL) | 46.2 ± 25.5 | 36.5 | 29.0-63.5 |
| IRI increase (µU/mL) | 8.8 ± 8.7 | 7.3 | 3.5-10.8 |
| IGI-Carbo70 | 0.28 ± 0.35 | 0.12 | 0.09-0.32 |
Table 2: Biomarker Related to Carbon-70.

Figure 1: Responses of glucose and IRI against carbohydrate load of 70 g.
IGI-carbo70 in 3 groups
Glucose increase against carbohydrate 70 g was investigated in 3 groups (Figure 2). Subjects were classified into 3 groups according to HbA1c value. They are low, middle and high group, which HbA1c was 6.0 ± 0.5%, 7.8 ± 0.6%, 9.7 ± 0.9%, respectively. Each group has 16 subjects and showed significant glucose increase between 0 min and 30 min (p<0.01). In 3 groups, glucose on 0 min and 30 min in median were 117-150, 166-203, 218-299 mg/dL, respectively.

Figure 2: Glucose elevation against carbohydrate load of 70 g in 3 groups.
Similarly, IRI increase against carbohydrate 70 g was investigated in 3 groups (Figure 3). Each group has 16 subjects and showed significant IRI increase between 0 min and 30 min (p<0.01). IRI on 0 min and 30 min in median were 4.4-12.8, 4.5-13.5, 4.2-9.9 μU/mL, respectively.

Figure 3: IRI elevation against carbohydrate load of 70 g in 3 groups.
Data from Figures 2 and 3, Insulinogenic Index (IGI)-carbohydrate 70 g (IGI-carbo70) was calculated and classified in 3 groups (Figure 4).

Figure 4: IGI-carbo70 in three groups.
The median level was decreased from low, medium and high group, with 0.25, 0.14 and 0.10, respectively.
Correlation of IGI-carbo70
Mutual correlations among IGI-carbo70 and other biomarkers were investigated (Table 3). IGI-carbo70 showed significant correlation with increment of glucose and IRI, and HOMA-β. M value showed significant correlation with basal glucose, increment of glucose and IRI, HOMA-R and HOMA-β.
| Basal | Increment | Morbus Value | HOMA | ||||||
|---|---|---|---|---|---|---|---|---|---|
| IGI-Carbo70 | |||||||||
| Glucose | IRI | Glucose | IRI | -R | -β | ||||
| -0.027 | 0.261 | -0.13 | -0.215 | 0.866 | 0.502 | -0.755 | C.C P.V |
||
| Basal Glucose | 0.854 | 0.067 | 0.365 | 0.132 | <0.001 | <0.001 | <0.001 | ||
| -0.027 | -0.002 | 0.507 | 0.439 | -0.117 | 0.849 | 0.59 | |||
| Basal IRI | 0.854 | 0.989 | <0.001 | 0.002 | 0.414 | <0.001 | <0.001 | ||
| 0.261 | -0.002 | -0.014 | -0.465 | 0.42 | 0.115 | -0.123 | |||
| Increment Glucose | 0.067 | 0.989 | 0.924 | 0.001 | 0.003 | 0.431 | 0.398 | ||
| -0.13 | 0.507 | -0.014 | 0.852 | -0.3 | 0.348 | 0.352 | |||
| Increment IRI | 0.365 | <0.001 | 0.924 | <0.001 | 0.036 | 0.017 | 0.016 | ||
| -0.215 | 0.439 | -0.465 | 0.852 | -0.456 | 0.256 | 0.349 | |||
| IGI | 0.132 | 0.002 | 0.001 | <0.001 | 0.001 | 0.079 | 0.017 | ||
| 0.866 | -0.117 | 0.42 | -0.3 | -0.456 | 0.295 | -0.734 | |||
| M value | <0.001 | 0.414 | 0.003 | 0.036 | 0.001 | 0.043 | <0.001 | ||
| 0.502 | 0.849 | 0.115 | 0.348 | 0.256 | 0.295 | 0.132 | |||
| HOMA-R | <0.001 | <0.001 | 0.431 | 0.017 | 0.079 | 0.043 | 0.367 | ||
| -0.755 | 0.59 | -0.123 | 0.352 | 0.349 | -0.734 | 0.132 | |||
| HOMA-β | <0.001 | <0.001 | 0.398 | 0.016 | 0.017 | <0.001 | 0.367 | ||
C.C: Correlation coefficient; P.V: P value; IGI-carbo70: Insulinogenic Index-carbo70; HOMA-R: Homeostasis Model Assessment Insulin Resistance; HOMA-β: Homeostasis Model Assessment for β Cell Function; IRI: Immuno-reactive Insulin.
Shadow areas represent significant correlations including <0.05, <0.01 and <0.001.
Table 3: Correlation among 8 related factors.
Discussion
Insulinogenic index (IGI) has been useful marker which measures the ratio of insulin increment to glucose increment in 75 g OGTT at 30 min [24,25]. Recent study revealed that the average IGI was 1.00, 0.69 and 0.46 in 3 groups which were group of normal glucose tolerance (NGT), group with fasting glucose 100-109 mg/dL, group with fasting glucose 110-125 mg/dL [26]. Another study revealed that average IGI was 1.02 in 1265 normal young volunteers and 0.80 in 1076 obese children/adolescents [27]. As to T2DM with and without aggravation of parameters, IGI in average was showed 0.3 and 0.5, respectively [28].
Furthermore, IGI has been used after a meal at 30 min [29-31]. The changes in IGI were correlated to the changes in the β-cell function in both normal glucose-tolerant and prediabetic individuals, which suggests it to be a valid proxy indicator for β-cell function in healthy individuals [29].
In Asian countries, overconsumption of starchy foods such as rice has induced a rapid and sharp postprandial hyperglycemia [32-34]. This increased glucose response is accompanied by an insulin surge and contributes to the etiology of diabetes [35].
Recently, effect of co-ingestion of amino acids with rice on glycemic and insulin response was investigated in 7 various patterns [36]. Rice with 68 mL of amino acid mixture showed the best results in reducing the peak blood level [36]. Its merit lies in enabling people living in Asia to reduce postprandial hyperglycemia due to carbohydrate-rich rice meals by the inclusion of a ready-to-drink amino acid mixture [37-39].
A liquid mixed meal test was tried for the indices of insulin secretion in patients with diabetes [40]. Participants ingested 237 mL high protein boost-HP (Nestle) consisting of 33 g carbohydrate, 15 g protein and 6 g fat, (%Calories: 55% carbohydrate, 25% protein, and 20% fat). IGI and also C-peptide-derived 30 minutes index and oral disposition index (ODI) from the mixed meal would be useful [41-43].
The effect of a rice bowl topped with beef to blood glucose was investigated [44]. This is one of famous Japanese fast food with protein 18.4 g, fat 20.9 g and carbohydrate 82.9 g, and it was given to 12 healthy volunteers with 26.9 years old in average. Blood glucose increased 65 mg/dL at 30 min. Thus, even if the subjects are healthy, blood glucose increase seems to be remarkable.
Ethnic difference for IGI was investigated using two 200 mL servings of Ensure Plus (Abbott Laboratories, Columbus, OH, USA) [45]. Each serving has 300 kcal, 40.4 g carbohydrate, 9.8 g fat and 12.5 g protein. Chinese, Malay and Asian Indians showed 36-45 mg/dL increase of blood glucose at 30 min, and its IGI was 0.64, 0.266 and 0.399, respectively.
Conclusion
Taking these results and discussion into consideration, research for postprandial hyperglycemia with mixed-nutrient load would be significant. Newly-proposed IGI-carbo70 was investigated, and there were several correlations among 8 related biomarkers. These findings suggest that current results would become the fundamental data and IGI-carbo70 could be the useful way to evaluate diabetic status by usual meal with mixed nutrients.
Acknowledgement
The part of the content of this article was presented at the 89th and 90th Scientific Meeting of Japan Endocrine Society (JES) Annual Congress, Kyoto, 2016 and 2017. The authors would like to thank the patients and staffs for their cooperation and support.
Conflicts of Interest
The authors declare that they have no conflicts of interest.
References
- Accurso A, Bernstein RK, Dahlqvist A, Draznin B, Feinman RD, et al. (2008) Dietary Carbohydrate Restriction in type 2 Diabetes mellitus and Metabolic syndrome: Time for a Critical Appraisal. Nutr Metab 5: 9.
- Shai I, Schwarzfuchs D, Henkin Y, Shahar DR, Witkow S, et al. (2008) Weight loss with a Low-Carbohydrate, Mediterranean, or Low-Fat Diet. N Engl J Med 359: 229-241.
- Schwarzfuchs D, Golan R, Shai I (2012) Four-year follow-up after two-year Dietary Interventions. N Engl J Med 367: 1373-1374.
- Atallah R, Filion KB, Wakil SM, Genest J, Joseph L, et al. (2014) Long-Term Effects of 4 Popular Diets on Weight Loss and Cardiovascular Risk Factors: A Systematic Review of Randomized Controlled Trials. Circ Cardiovasc Qual Outcomes 7: 815-827.
- Meng Y, Bai H, Wang S, Li Z, Wang Q, et al. (2017) Efficacy of Low Carbohydrate Diet for type 2 Diabetes Mellitus Management: A Systematic Review and Meta-analysis of Randomized Controlled Trials. Diabetes Res Clin Pract 131: 124-131.
- Atkins R (1998) Dr. Atkins’ New Diet Revolution. Avon books, New York.
- Bernstein RK (2007) Dr. Bernstein’s Diabetes solution: The Complete Guide to Achieving Normal Blood Sugars. Little, Brown US, New York.
- Ebe K, Ebe Y, Yokota S, Matsumoto T, Hashimoto M, et al. (2004) Low Carbohydrate Diet (LCD) treated for three cases as Diabetic Diet therapy. Kyoto Medical Association J 51: 125-129.
- Bando H, Ebe K, Nakamura T, Bando M, Yonei Y, et al. (2016) Low Carbohydrate Diet (LCD): Long and Short-term Effects and Hyperketonemia. Glycative Stress Res 3: 193-204.
- Muneta T, Kawaguchi E, Nagai Y, Matsumoto M, Ebe K, et al. (2016) Ketone Body Elevation in Placenta, Umbilical Cord, Newborn and Mother in Normal Delivery. Glycative Stress Res 3: 133-140.
- Bando H, Ebe K, Muneta T, Bando M, Yonei Y, et al. (2017) Effect of Low Carbohydrate Diet on type 2 Diabetic Patients and usefulness of M-value. Diabetes Res Open J 3: 9-16.
- Ebe K, Bando H, Muneta T, Bando M, Yonei Y, et al. (2017) Effect of Low Carbohydrate Diet (LCD) for Diabetic Patients with Hypertriglycemia. Endocrinol Metab 1: 104.
- Feinman RD, Pogozelski WK, Astrup A, Bernstein RK, Fine EJ, et al. (2015) Dietary Carbohydrate Restriction as the first Approach in Diabetes Management: Critical Review and Evidence Base. Nutrition 31: 1-13.
- Bando H, Ebe K, Muneta T, Bando M, Yonei Y, et al. (2017) Clinical Effect of Low Carbohydrate Diet (LCD): Case Report. Diabetes Case Rep 2: 124.
- Japan Diabetes Association (2013) Diabetes Clinical Practice Guidelines Based on Scientific Evidence.
- The Ministry of Health and Welfare, Japan (2015) National Health Nutrition Survey Results.
- Schlichtkrull J, Munck O, Jersild M (1965) The M-value, an Index of Blood Sugar Control in Diabetics. Acta Med Scand 177: 95-102.
- Moberg E, Kollind M, Lins PE, Adamson U (1993) Estimation of Blood-Glucose Variability in Patients with Insulin-Dependent Diabetes mellitus. Scand J Clin Lab Invest 53: 507-514.
- Siegelaar SE, Holleman F, Hoekstra JBL, Devries JH (2010) Glucose Variability; Does It Matter? Endocrine Reviews 31: 171-182.
- Monnier L, Colette C (2011) Glycemic Variability: Can We Bridge the Divide Between Controversies? Diabetes Care 34: 1058-1059.
- Baghurst P (2011) Calculating the Mean Amplitude of Glycemic Excursion from Continuous Glucose Monitoring Data: An Automated Algorithm. Diabetes Technol Ther 13: 296-302.
- Yanai H (2015) Four Step Excel Statistics, (4th edn.), Seiun-sha Publishing Co.Ltd, Tokyo.
- Kosaka K, Kuzuya T, Yoshinaga H (1996) A Prospective Study of Health Check Examinees for the development of Non-Insulin-Dependent Diabetes mellitus: Relationship of the Incidence of Diabetes with the Initial Insulinogenic Index and Degree of Obesity. Diabet Med 13: S120-S126.
- Matsuda M, DeFronzo RA (1999) Insulin Sensitivity Indices obtained from Oral Glucose Tolerance Testing: Comparison with the Euglycemic Insulin Clamp. Diabetes Care 22: 1462-1470.
- Kim DL, Kim SD, Kim SK, Park S, Song KH, et al. (2016) Is an Oral Glucose Tolerance Test Still Valid for Diagnosing Diabetes Mellitus? Diabetes Metab J 40: 118-128.
- Morandi A, Bonnefond A, Lobbens S, Yengo L, Miraglia Del Giudice E, et al. (2016) Associations Between Type 2 Diabetes-Related Genetic Scores and Metabolic Traits, in Obese and Normal-Weight Youths. J Clin Endocrinol Metab 1: 4244-4250.
- Teshima N, Shimo M, Miyazawa K, Konegawa S, Matsumoto A, et al. (2015) Effects of Sugar-Sweetened Beverage intake on the development of type 2 Diabetes Mellitus in subjects with Impaired Glucose Tolerance: The Mihama Diabetes Prevention Study. J Nutr Sci Vitaminol 61: 14-19.
- Hanson RL, Pratley RE, Bogardus C (2000) Evaluation of Simple Indices of Insulin Sensitivity and Insulin Secretion for use in Epidemioiogic Studies. Am J Epidemiol 151: 190-198.
- Gerich JE (2003) Clinical Significance, Pathogenesis, and Management of Postprandial Hyperglycemia. Arch Int Med 163: 1306-1316.
- Tura A, Kautzky-Willer A, Pacini G (2006) Insulinogenic Indices from Insulin and C-Peptide: Comparison of Beta-Cell Function from Ogtt And Ivgtt. Diabetes Res Clin Pract 72: 298-301.
- Ceriello A, Esposito K, Piconi L (2008) Oscillating Glucose is More Deleterious to Endothelial Function and Oxidative Stress than Mean Glucose in Normal and Type 2 Diabetic Patients. Diabetes 57: 1349-1354.
- Wolever TM, Jenkins DJ, Jenkins AL (1991) The Glycemic Index: Methodology and Clinical Implications. Am J Clin Nutr 54: 846-854.
- Brouns F, Bjorck I, Frayn K (2005) Glycaemic Index Methodology. Nutr Res Rev 18, 145-171.
- Ludwig DS (2002) The Glycemic Index: Physiological Mechanisms Relating to Obesity, Diabetes and Cardiovascular Disease. JAMA 287: 2414-2423.
- Soong YY, Lim J, Sun L, Henry CJ (2015) Effect of Co-Ingestion of Amino Acids with Rice on Glycaemic and Insulinaemic Response. Br J Nutr 114 11: 1845-51.
- Villegas R, Liu S, Gao Y-T (2007) Prospective Study of Dietary Carbohydrates, Glycemic index, Glycemic load, and Incidence of type 2 Diabetes Mellitus in middle-aged Chinese women. Arch Inter Med 167: 2310-2316.
- Nanri A, Mizoue T, Noda M (2010) Rice Intake and Type 2 Diabetes in Japanese Men and Women: The Japan Public Health Center-Based Prospective Study. Am J Clin Nutr 92: 1468-1477.
- Mohan V, Radhika G, Sathya RM (2009) Dietary Carbohydrates, Glycaemic Load, Food Groups and Newly Detected Type 2 Diabetes Among Urban Asian Indian Population In Chennai, India. Br J Nutr 102: 1498-1506.
- Bacha F, Gungor N, Lee S, De Las Heras J, Arslanian S, et al. (2013) Indices of Insulin Secretion During A Liquid Mixed-Meal Test in Obese Youth with Diabetes. J Pediatr 162: 924-929.
- Tfayli H, Bacha F, Gungor N, Arslanian S (2010) Islet Cell Antibody-Positive Versus - Negative Phenotypic Type 2 Diabetes in Youth: Does the Oral Glucose Tolerance Test Distinguish Between the Two. Diabetes Care 33: 632-638.
- Utzschneider KM, Prigeon RL, Faulenbach MV, Tong J, Carr DB, et al. (2009) Oral Disposition Idex Predicts the Development of Future Diabetes Above and Beyond Fasting and 2-H Glucose Levels. Diabetes Care 32: 335-341.
- Sjaarda GL, Bacha F, Lee S, Tfayli H, Andreatta E, et al. (2012) Oral Disposition Index in Obese Youth from Normal to Prediabetes to Diabetes: Relationship to Clamp Disposition Index. J Pediatr 161: 51-57.
- Kawabata A, Yagi M, Ogura M, Yonei Y (2015) Postprandial Blood Glucose Level after Intake of a Bowl of Rice Topped with Beef. Glycative Stress Research 2: 67-71.
- Tan VMH, Lee YS, Venkataraman K, Khoo EYH, Tai ES, et al. (2015) Ethnic Differences in Insulin Sensitivity an Beta-Cell Function among Asian Men. Nutrition & Diabetes 5: e173.
Citation: Bando H, Ebe K, Muneta T, Bando M, Yonei Y (2017) Proposal for Insulinogenic Index (IGI)-Carbo70 as Experimental Evaluation for Diabetes . J Clin Exp Endocrinol 1: 102.
Copyright: © 2017 Bando H, et al. This is an open-access article distributed under the terms of the Creative Commons Attribution License, which permits unrestricted use, distribution, and reproduction in any medium, provided the original author and source are credited.
Share This Article
Open Access Journals
Article Usage
- Total views: 5743
- [From(publication date): 0-2017 - Apr 18, 2024]
- Breakdown by view type
- HTML page views: 4922
- PDF downloads: 821