

Indexed In
- Open J Gate
- Genamics JournalSeek
- Academic Keys
- ResearchBible
- Cosmos IF
- Access to Global Online Research in Agriculture (AGORA)
- Electronic Journals Library
- RefSeek
- Directory of Research Journal Indexing (DRJI)
- Hamdard University
- EBSCO A-Z
- OCLC- WorldCat
- Scholarsteer
- SWB online catalog
- Virtual Library of Biology (vifabio)
- Publons
- Geneva Foundation for Medical Education and Research
- Euro Pub
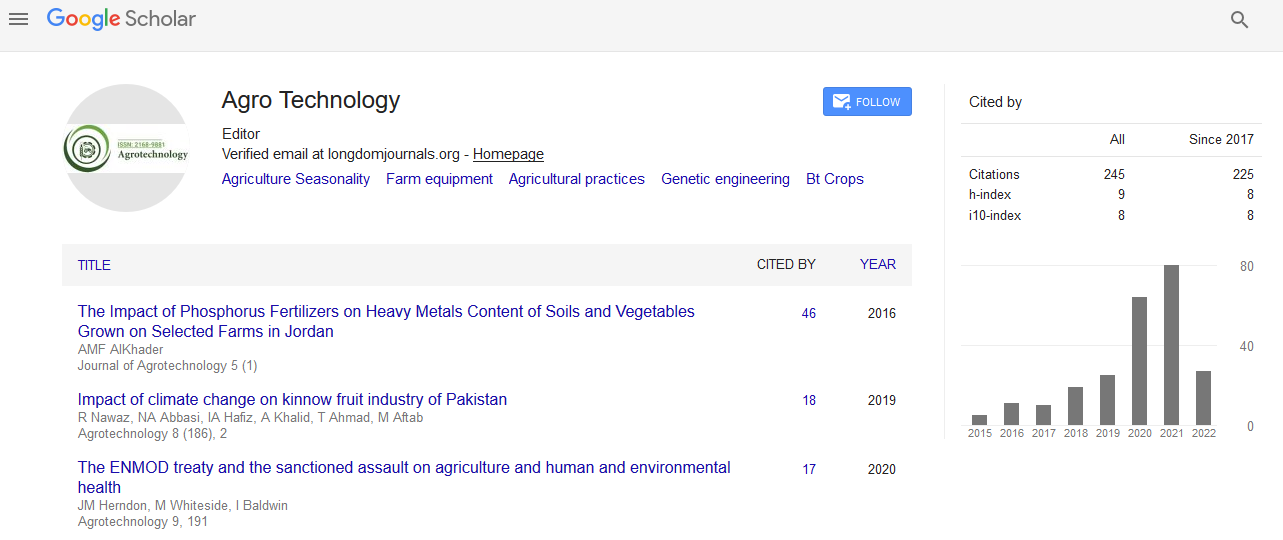
- Google Scholar
Useful Links
Share This Page
Journal Flyer
Open Access Journals
- Agri and Aquaculture
- Biochemistry
- Bioinformatics & Systems Biology
- Business & Management
- Chemistry
- Clinical Sciences
- Engineering
- Food & Nutrition
- General Science
- Genetics & Molecular Biology
- Immunology & Microbiology
- Medical Sciences
- Neuroscience & Psychology
- Nursing & Health Care
- Pharmaceutical Sciences
Spectral signature development for rain fed cotton using remote sensing techniques with NDVI Data sets
3rd International Conference on Agriculture & Horticulture
October 27-29, 2014 Hyderabad International Convention Centre, India
N Showri Raju, R Nagarjuna Kumar, N Ravi Kumar and V V Sumanth Kumar
Scientific Tracks Abstracts: Agrotechnol
Abstract:
Research and technological advances in the field of remote sensing have greatly enhanced our ability to detect and quantify physical and biological parameters that affect the area and productivity of agricultural crops. Features on the Earth reflect, absorb, transmit, and emit electromagnetic energy from the sun. Special digital sensors have been developed to measure all types of electromagnetic energy as it interacts with objects in all of the ways listed above. The ability of sensors to measure these interactions allows us to use remote sensing to measure features and changes on the Earth and in our atmosphere. A measurement of energy commonly used in remote sensing of the Earth is reflected energy (e.g., visible light, near-infrared, etc.) coming from land and water surfaces. The amount of energy reflected from these surfaces is usually expressed as a percentage of the amount of energy striking the objects. Reflectance is 100% if all of the light striking and object bounces off and is detected by the sensor. If none of the light returns from the surface, reflectance is said to be 0%. In most cases, the reflectance value of each object for each area of the electromagnetic spectrum is somewhere between these two extremes. Across any range of wavelengths, the percent reflectance values for landscape features such as water, sand, roads, forests, etc. can be plotted and compared. Such plots are called spectral response curves or spectral signatures. Differences among spectral signatures are used to help classify remotely sensed images into classes of landscape features since the spectral signatures of like features have similar shapes. Spectral information recorded by a sensor, the more information that can be extracted from the spectral signatures. In this work, it was tried to identify the spectral signatures of cotton using NDVI data Sets.