 |
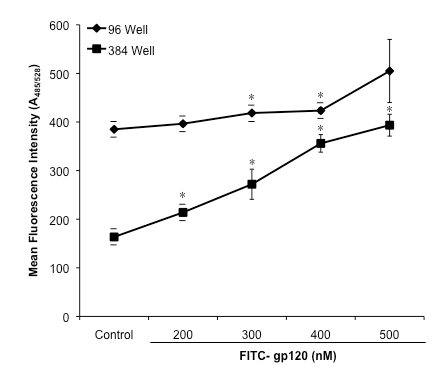
| Figure 1: Reagent titration and assay miniaturization from 96 well to 384 well format. In each well, 200 nM of DC-SIGN was incubated with 200, 300, 400 or 500 nm of FITC-gp120. Wells with only assay buffer served as the control. Data represents mean fluorescence intensity ± standard error of mean (S.E.M) of three independent experiments each performed in duplicate. A Student’s t test determined the statistical significance of a sample by having a P-value of ≤ 0.05 and is denoted by an asterisk (*). |