 |
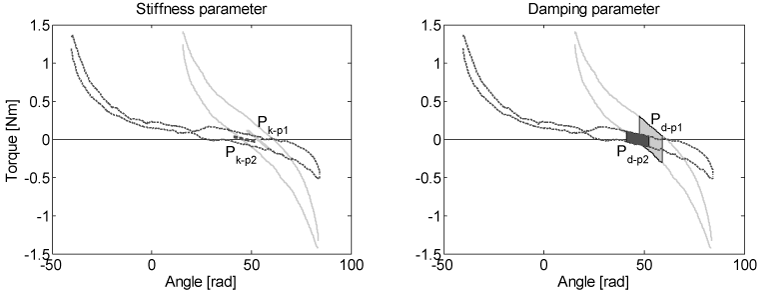
| Figure 3: Stiffness in rest test result for patient A (light grey, solid —) and patient B (dark grey, dashed ---). Thick lines around zero (left figure) indicate average slope of the data at those angles (Pk) and intervals around zero (right figure) show the (Pd). |