 |
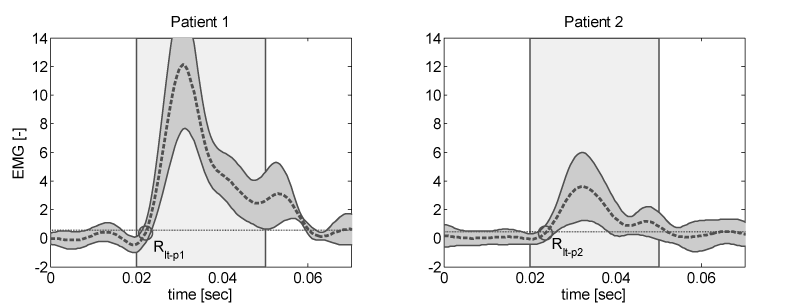
| Figure 7: Neural looptime test datasets for patient A (left) and patient B (right). Average and standard deviation of nine FCR EMG responses (mean: dashed line ---, standard deviation: grey surrounding surface) and corresponding analysis interval and values (Rlt: circle O and RAUC:surface under --- within the indicated interval [0.02–0.05] sec). Dotted line (•••) indicates the 2.81 times the standard deviation of the background EMG. |