 |
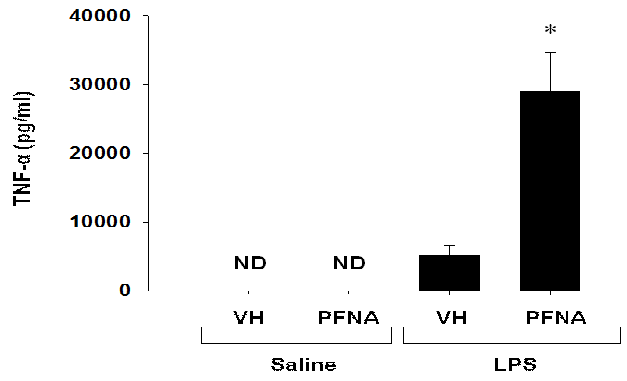
| Figure 8: Increase in LPS-induced serum TNFα in PFNA-treated male mice. Blood was collected from PFNA-treated mice 1hr 30 min after they were injected with 1mg/kg LPS or saline and serum TNFα levels were analyzed by ELISA. The data are presented as mean ± SE. ND denotes samples that were below the level of detection of the assay. * denotes p<0.05 as compared to the vehicle (VH) control. |