 |
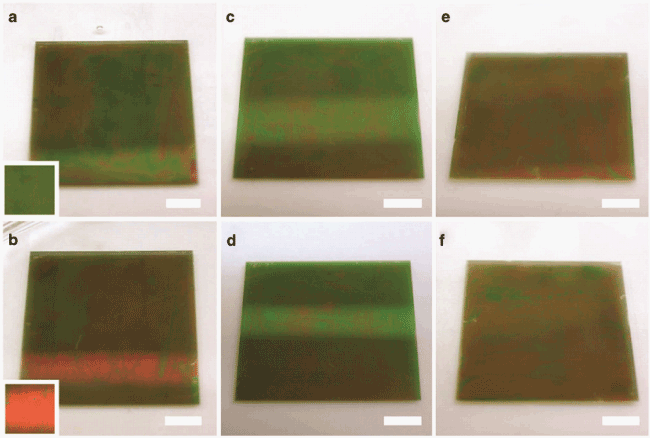
| Figure 5: APBA-functionalized microgel based etalons show visible color differences when they are soaked in (a) 5 mM pH 9 carbonate buffer versus (b) a pH 9 carbonate buffer containing 3 mg/mL glucose for 2 hours. Various etalon controls, e.g., (c, d) etalons fabricated by exposure to APBA only, and (e, f) EDC only, show no significant color change (top) before and (bottom) after glucose exposure. To make the etalonís color more apparent, the image brightness of the select region of the etalon was increased using image processing software. Scale bars are 5 mm. Reproduced with permission from [32] Copyright 2012, Springer. |