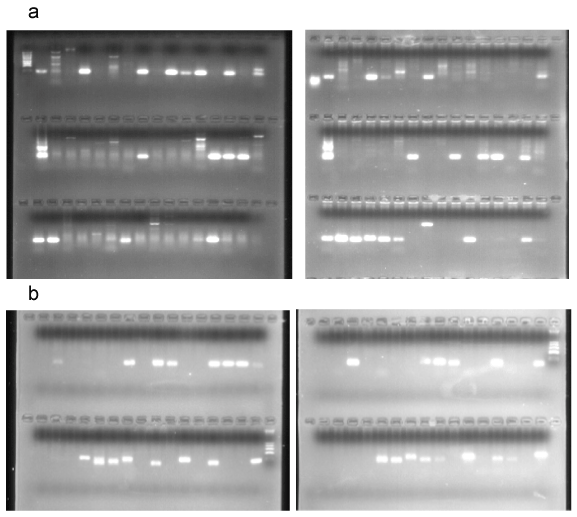
The left panel of Figure 1a corresponds to one sturgeon hybrid cell line and the right panel to another cell line. Similarly, Figure 1b corresponds to two oyster hybrid cell lines. Each slot corresponds to the products of PCR amplification of one marker.