 |
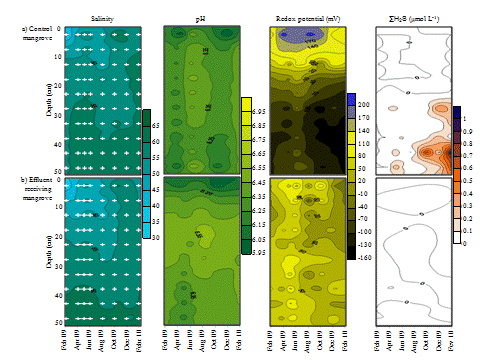
| Figure 5: Temporal evolution of pore-water parameters: salinity, pH, redox potential, and total free dissolved sulfur (ΣH2S) (means of tree replicates), in the control mangrove (a) and effluent receiving mangrove (b). Graphical representation was performed under Surfer 8, with Krigging interpolation method for extrapolating values between sampling periods. Measurement points are represented by crosses visible on the graphs of salinity (averaged on 3 replicates). |