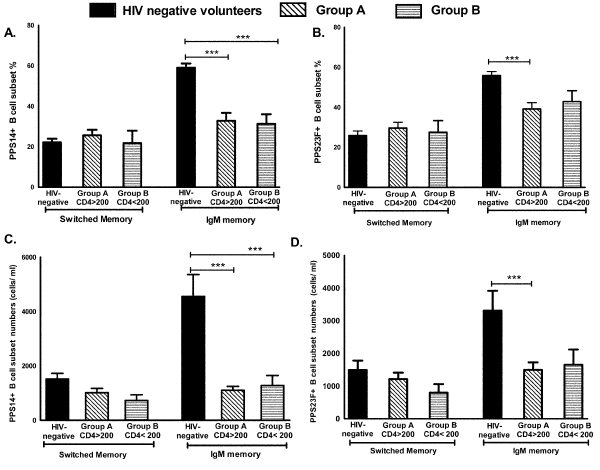
Panel C-D: Post vaccination PPS14 (C) and 23F (D) -specific switched and IgM memory B cell numbers were compared between HIV-negative volunteers (n=22, black bars) compared to group A (n=29, slanted stripes) and group B (n=10, horizontal stripes).100,000 events were recorded for each sample. Group comparisons were performed using analysis of variance (ANOVA) with Tukeys post-hoc test.Data are represented as mean ± standard errors of the mean (SEM). *p<0.05, **p<0.01, ***p<0.001.