 |
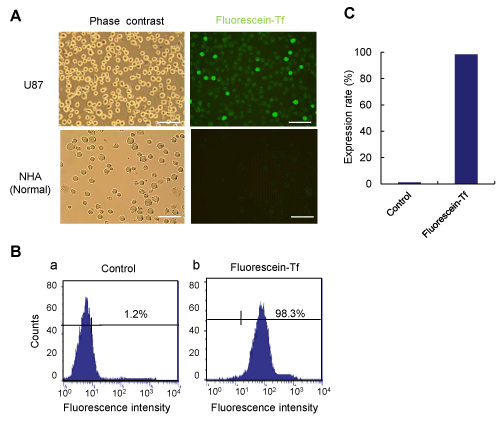
| Figure 1: Analysis of the expression of transferrin receptor on the NHA and U87 cells. (A) Phase and fluorescent images of NHA and U87 cells after treatment with fluorescein-Tf. The detected green fluorescence shows the expression of transferrin receptor on the U87 cells. The white bar indicates 100 μm. (B) The analysis of the expression of transferrin receptor on the surface of U87 cells using flow cytometry. (C) The expression of transferrin receptor on the U87 cells. |