 |
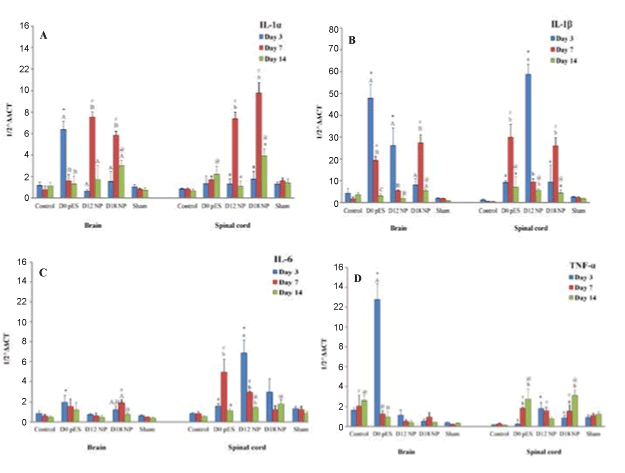
| Figure 1: The expression of IL-1α, IL-1β, IL-6, and TNF-α in the brain and the spinal cord on day 3, 7, and 14 after the transplantation of D0 pES, D12 NP, and D18 NP quantified by real-time PCR. ABC in the brain and abc in the spinal cord indicate significant differences within treatments compared with day 3; *#@ in the brain and the spinal cord indicate significant differences on day 3, 7, and 14 compared with control, respectively |