 |
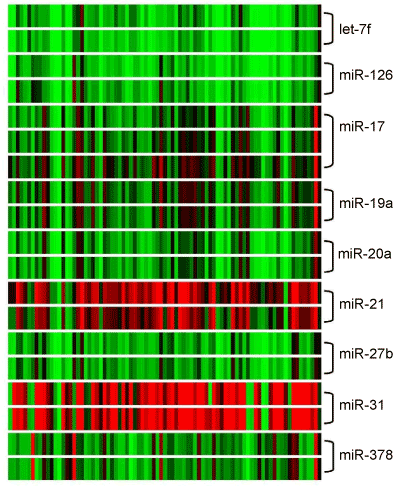
| Figure 5: Hierarchical clustering of selected angiomiRs. Displayed are all 83 HNSCC tumour specimens with a pool of healthy skin mucosa. Condition tree from left to right is T1 status to T4 status and healthy skin mucosa pool as last one. Expression factor of 1 is black. Expression factors over 1 are red and expression factors lower than one are green. Expression factor of genes from healthy skin mucosa pool are set as 1 and black. |