 |
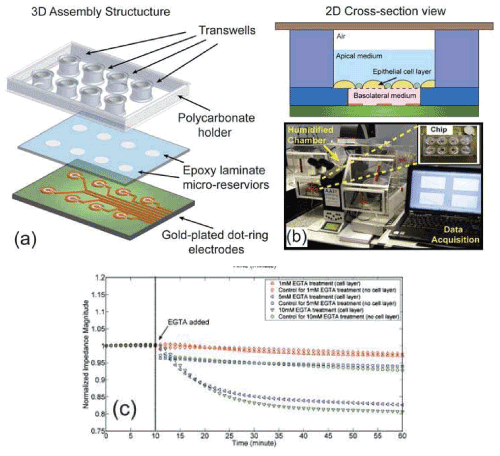
| Figure 2: 3D assembly structure and 2D cross-section of the bio-impedance chip (a). Experimental system instrumentation (b). Time-lapse data showing the disruption of epithelial barrier function. Normalized impedance magnitude data from EGTA treatments (different concentrations as indicated were tested) (c) [38]. |