 |
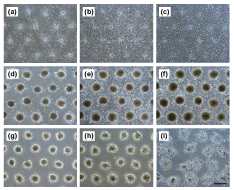
| Figure 3: Phase-contrast micrographs of the patterned spheroid spreading morphologies of 3T3 cells HepG2 cells, and rat primary hepatocytes on the collagen-coated dish. (a–c) 3T3 cells, (d–f) HepG2 cells, and (g–i) rat primary hepatocytes. (a) 24 hours, (b, d, g) 48 hours, (c, e, h) 72 hours, and (f, i) 7 days after the ST chip was flipped. The bar represents 500 μm. |