 |
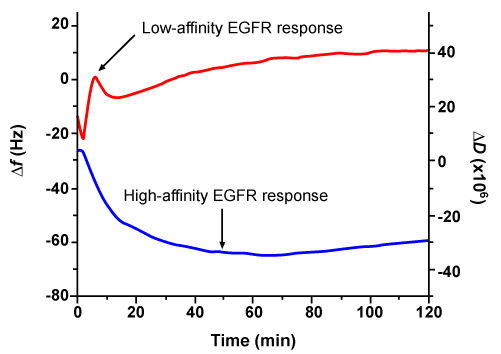
| Figure 4: Real-time QCM measurements of the responses of A431 cells to 10 nM EGF exposure [56]. The ΔD response (blue curve) corresponds to signalling mediated by high-affinity EGFR. The Δf response (red curve) represents the response to signalling mediated by low-affinity EGFR. |