 |
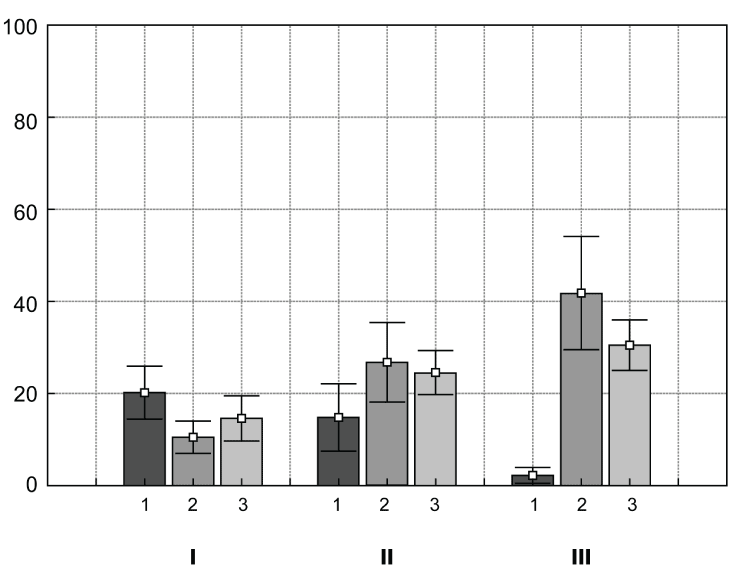
| Figure 1: Ethanol preference in the «two bottle» test (I) before forced alcoholization and (II) 27 and (III) 54 days after the beginning of forced alcoholization. The ordinate axis shows the percentage of consumed ethanol from the total amount of liquid consumed in the test (data are expressed as the arithmetic mean value and the standard error of the mean). Designations: 1, rats subjected to forced alcoholization and kept in groups with the rats that received water; 2, rats subjected to forced alcoholization in the whole group; 3, control rats that received water. |