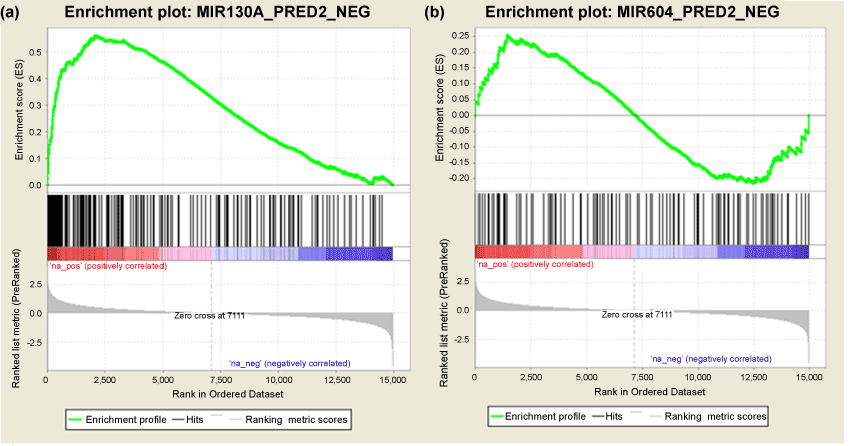
The enrichment scores (shown in the upper curve) were calculated along the ranked genes (the bottom histogram, from left to right, i.e., from upregulated to downregulated). The vertical lines in the middle indicate the location of the members of a given gene set. The maximum enrichment score not only reflects the possibility that a set of putative target genes of miR130a is overrepresented by a set of the ranked genes, but also implies that the 77 leading genes made major contribution to the maximum enrichment score.