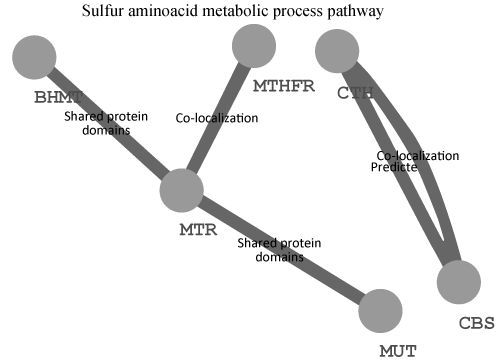
The figure graphically shows the genes involved in the Sulfur aminoacid metabolic process pathway that resulted to be the best associated with the depressive phenotype of our patients. The gray points represent the genes and the links between them are also shown, as Cytoscape represented them.