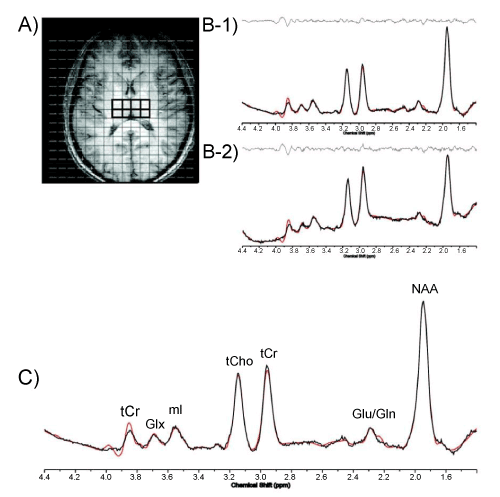
 Abbreviations: Cr: Creatine; Cho: Choline; ML: Myo-Inositol; NAA: N-acetyl-aspartate; Glu: Glutamate; Gln: Glutamine
 Abbreviations: Cr: Creatine; Cho: Choline; ML: Myo-Inositol; NAA: N-acetyl-aspartate; Glu: Glutamate; Gln: Glutamine
 |
| Figure 1: (A-C) A. Axial T1-weighted representative image depicting MRSI grid with voxels positioned in the left and right thalamus, and corresponding J=0.0 Hz sample spectra from voxels in the left (B-1) and right (B-2) thalamus. C. J=0.0 Hz spectrum shown with LCModel fit and labeled metabolites. |