 |
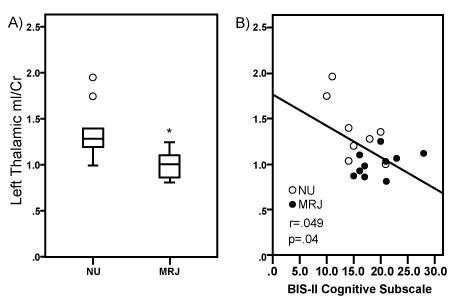
| Figure 3: Myo-Inositol (mI)/Creatine (Cr) ratios in the left thalamus (lThal) in NU and MRJ-using groups are shown. A. Significant group differences in mI/Cr ratios. Values are the means ± SD. *p=0.05 relative to NU lThal mI/Cr ratios. B. Scatterplot showing significant correlation between mI/Cr ratios and reported BIS-11 cognitive impulsivity subscale scores. |