 |
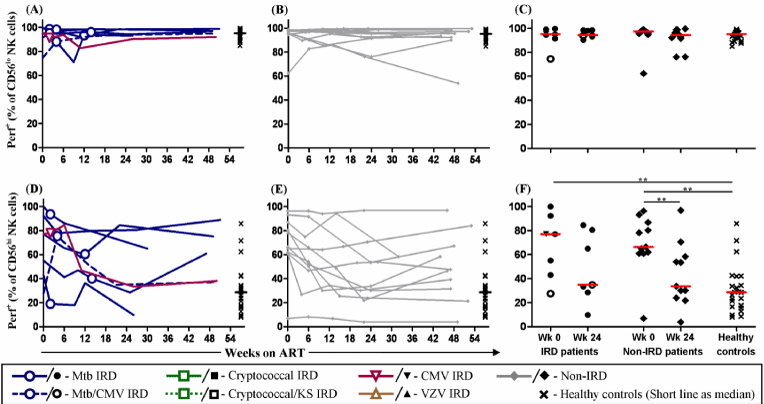
| Figure 4: Longitudinal evaluation of perforin expression on CD56lo NK cells (A,B,C) or on CD56hi NK cells (D,E,F) in HIV patients experiencing IRD (A,D) and in non- IRD patients (B,E). Cross-sectional comparison of perforin expression between IRD patients, non-IRD patients and healthy controls (C,F). Horizontal lines represent median values. * = p<0.05, ** = p<0.01, *** = p<0.001. |