 |
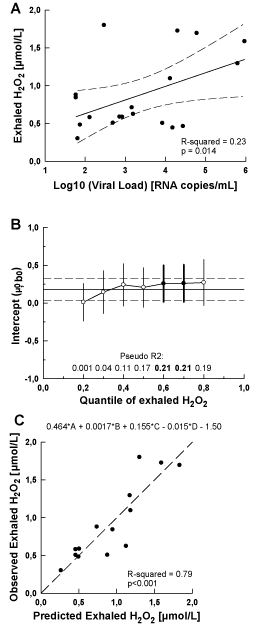
| Figure 3: Regression models in HIV-infected patients without signs and symptoms of opportunistic lung disease (OLD-negative). Linear regression (A - top) to estimate changes in exhaled H2O2 (y) as a function of log10- transformed detectable HIV-1 viral load (x). Solid line: slope (β1); long dashed lines: 95% confidence intervals. Quantile regression (B-middle) to estimate relationships between exhaled H2O2 and log10-transformed detectable HIV-1 viral load for the exhaled H2O2 distribution from 0.2 to 0.8 quantiles. Solid line: slopes for quantiles (b1), connected with white circles (non-significant) or black circles (significant at p<0.05) and with error bars corresponding to 95% confidence intervals (bolded if p<0.05). Linear regression slope β1 is shown as solid line with long dashed lines. corresponding to 95% confidence intervals. Multiple linear regression (C - bottom) in HAART-treated subgroup only, with exhaled H2O2 as the dependent variable and log10-transformed HIV-1 detectable viral load (A), CD4 count (B), HIV-infection duration (C) and HAART duration (D) as the independent variables. Predicted values of exhaled H2O2 from the multiple regression equation are graphed on the X-axis and the observed values of exhaled H2O2 are plotted on the Y-axis. |