 |
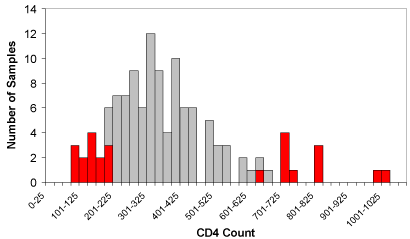
| Figure 5: A histogram is shown for the distribution of CD4 counts observed when the CD4% level was in a band between 15% and 19%. The data has been drawn from the African study where the density of sample points was sufficiently high to create an illustrative histogram. The mean CD4 count is approximately 350cells/microliter (a commonly used decision point) with approximately 2/3 of CD4 counts lying between 240cells/microliter and 470cells/microliter. CD4 counts obtained from persons with total lymphocyte counts that were outside the African reference range (1,200 – 3,700 lymphocytes/microliter) are shown with red bars. |