 |
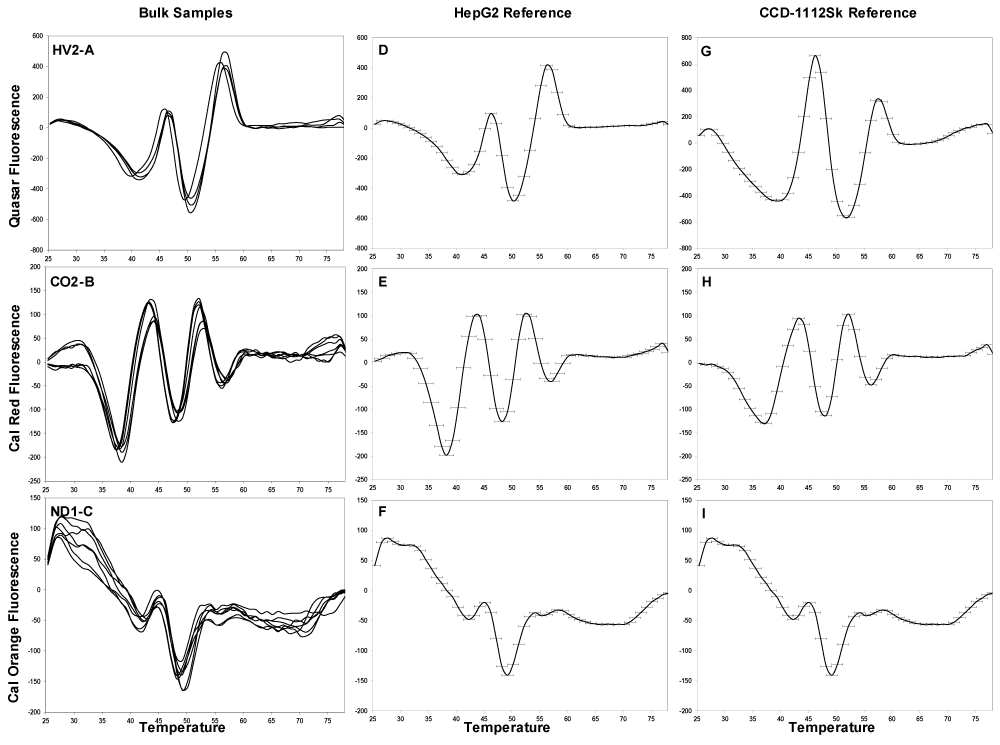
| Figure 1: Reference fluorescent signatures for the HepG2 and CCD-1112Sk cell lines. Multiple bulk samples (approximately 1000-genome each) analyzed and averaged (A-C). Confidence intervals (three standard deviations) were then applied to the signature (D-F). Any signature shift that fell outside of this reference was considered a true shift. The same was done for the CCD-1112Sk amplicons (G-I). |