 |
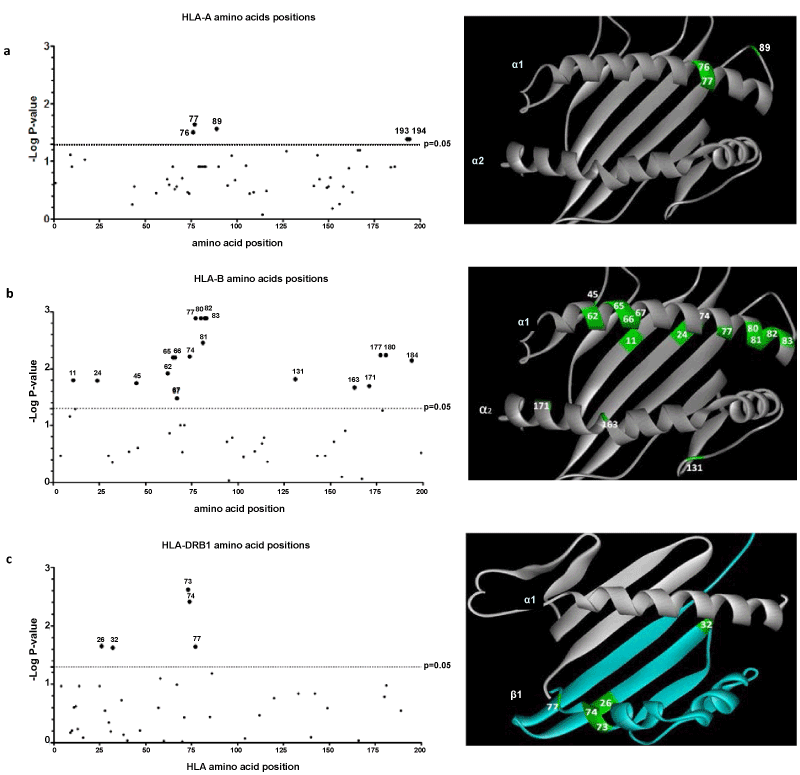
| Figure 1: Analysis of all polymorphic binding pocket amino acid positions in the study population. On the left panels, are shown the -Log P values of all the amino acid positions of peptide binding pocket, all the significant positions are shown in the graph. On the right panels, are shown the significant amino acid positions within the peptide’s binding pocket. (A) Analysis of polymorphic HLA-A amino acid positions. (B) Analysis of polymorphic HLA-B amino acid positions. (C) Analysis of polymorphic HLA-DRB1 amino acid positions. All statistical analysis has been performed using Chi-square test with Bonferroni correction considering the number of polymorphisms founded in the population for each HLA amino acid position evaluated. When in the comparisons the number of observations was below 5 a Chi-square per trend has been used. |