 |
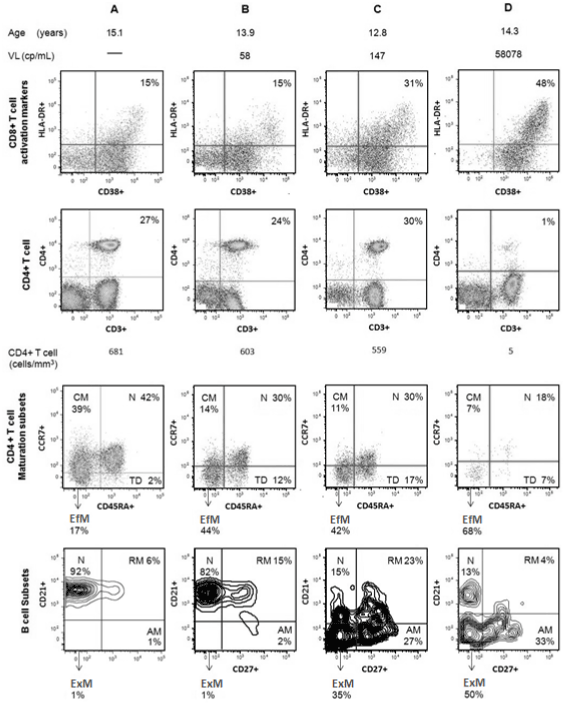
| Figure 2: Cytometric flow chart of cell subpopulations of a healthy non-HIV-infected adolescent (A), a HIV-infected patient who maintained hepatitis A antibodies after 7 years (B), a HIV-infected patient who did not have hepatitis A antibodies after 7 years but responded to the two doses of revaccination(C) and HIV-infected patient from the HAV seronegative group who did not respond to the revaccination (D). CM=Central Memory; N=Naïve; EfM= Effector Memory; TD=Terminally Differentiated; RM=Resting Memory; ExM=Exhausted Memory; AM=Activated Memory. Pseudo-color plot was used for T cells and contour plot, for B cells. |