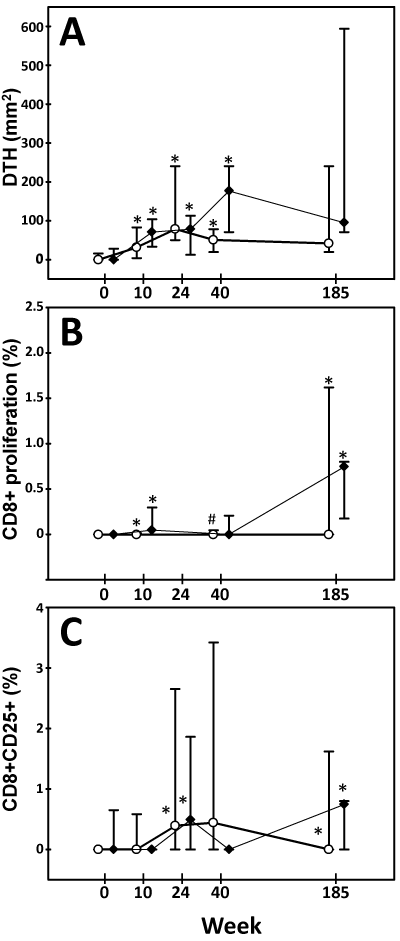
a) Vacc-5q DTH skin induration areas. The size was significantly increased from baseline in both study arms at weeks 10, 24, and 40 (marked with *), and weeks 4 and 28 (not shown). There were no significant differences between the study arms.
b) Proliferative CD8+ T cell responses to Vacc-5q peptides. The responses were significantly increased from baseline in both study arms at weeks 10 and 185 (marked with *), and in the non-ART group at week 24 (marked with #). There were no significant differences between the two study arms.
c) CD8+ T cell activation in terms of CD25 expression. The responses were significantly increased from baseline in both study arms at weeks 24, and 185 (marked with *), and at week 4 (not shown).