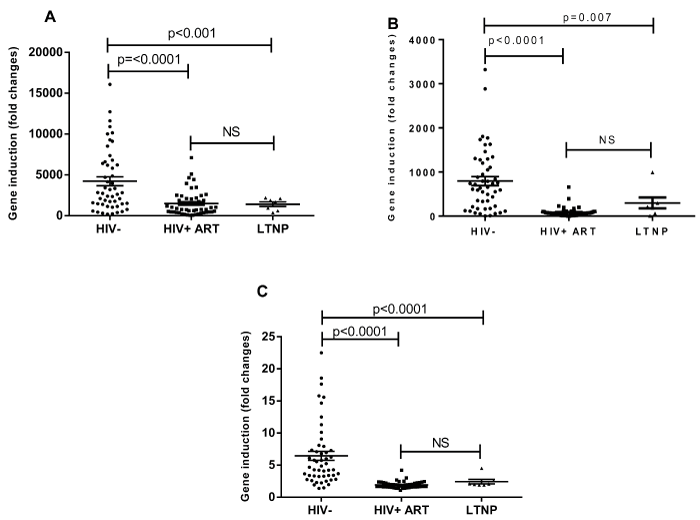
PBMCs from three patient groups (HIV negative controls, HIV+ ART patients and LTNP) were either mock transfected (lipid alone) or transfected with 3 ug of linearized plasmid non-coding plasmid DNA using Lipofectamine 2000 and left for 22 hours. Total RNA was extracted and subjected to qRT-PCR. The amount of gene induction following DNA transfection was calculated for IFN-λ1 (A), IFN-β (B) and RANTES (C) by comparing gene expression levels from DNA transfected PBMCs with that of mock transfected PBMCs (using the delta-delta Ct method).