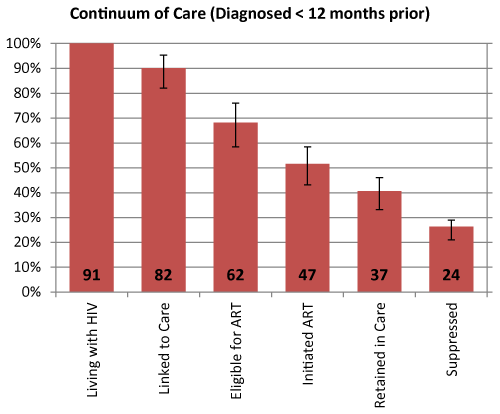
[Caption] Cascade diagram of the HIV continuum of care among those diagnosed within 12 months of taking the survey, showing the number of respondents that are in each stage and as a proportion of the total number of respondents recently diagnosed with HIV. Error bars show 95% confidence intervals.