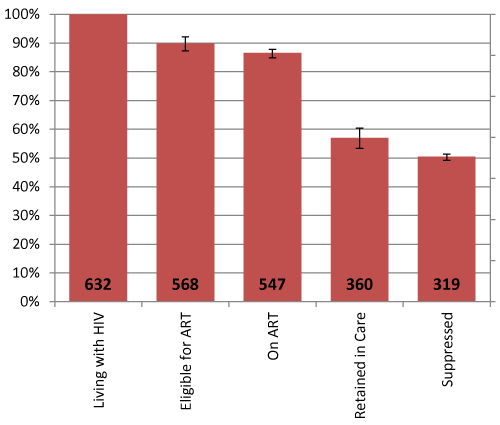
[Caption] Cascade diagram of the HIV continuum of care among those diagnosed more than 12 months before taking the survey, showing the number of respondents that are in each stage and as a proportion of the total number of respondents diagnosed with HIVfor more than 12 months. Error bars show 95% confidence intervals.