 |
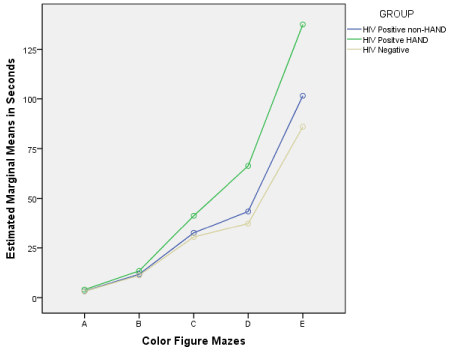
| Figure 2: Mean difference values (seconds) for each trial of Color Figure Mazes (CFM) between the HIV-seronegative, non-HAND and HAND groups. Group differences were found on a Repeated Measures Analysis of Covariance controlling for pre-morbid IQ (p<.001, Partial Eta-Squared=0.179). |