 |
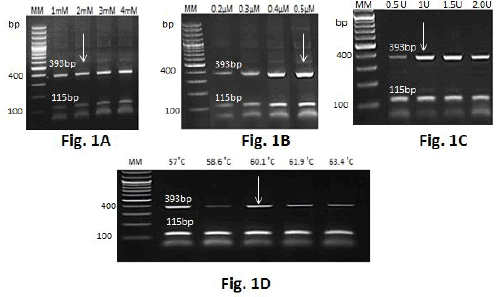
| Figure 1: Agarose gel electrophoresis analysis after optimization process: MM: 100-bp ladder (Fermentas); (A) MgCl2; (B) primer (C) Go taq enzyme; (D) annealing temperature. Optimal concentrations are represented with white arrows as well as optimal temperature for annealing process. |