 |
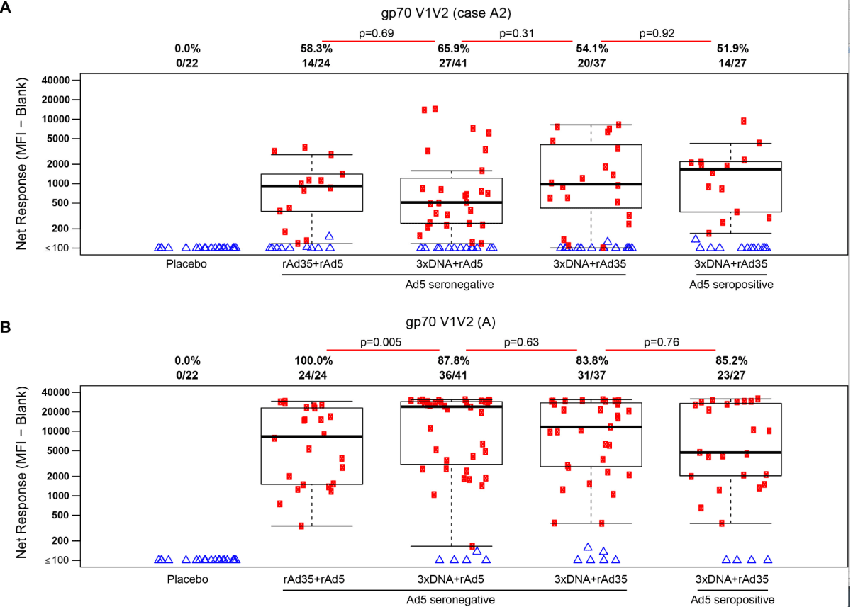
| Figure 3: Binding antibody net responses to A) gp70 V1/V2 (Case A2) used in the RV144 trial and B) gp70 V1/V2 (A), the V1V2 antigen contained in the VRC A vaccine strain 4 weeks after the boost vaccination as measured by median fluorescence intensity (MFI)-Blank where ‘Blank’ is a sample specific background measure. Responders are shown in red circles and non-responders in blue triangles. Box plots display the distribution of positive responses for the vaccinees for each antigen. P-values are derived from Lachenbruch’s test comparing rAd5 and rAd35 boosted groups in Ad5 seronegative individuals and the Ad35-boosted group in Ad5 seropositive individuals. |