 |
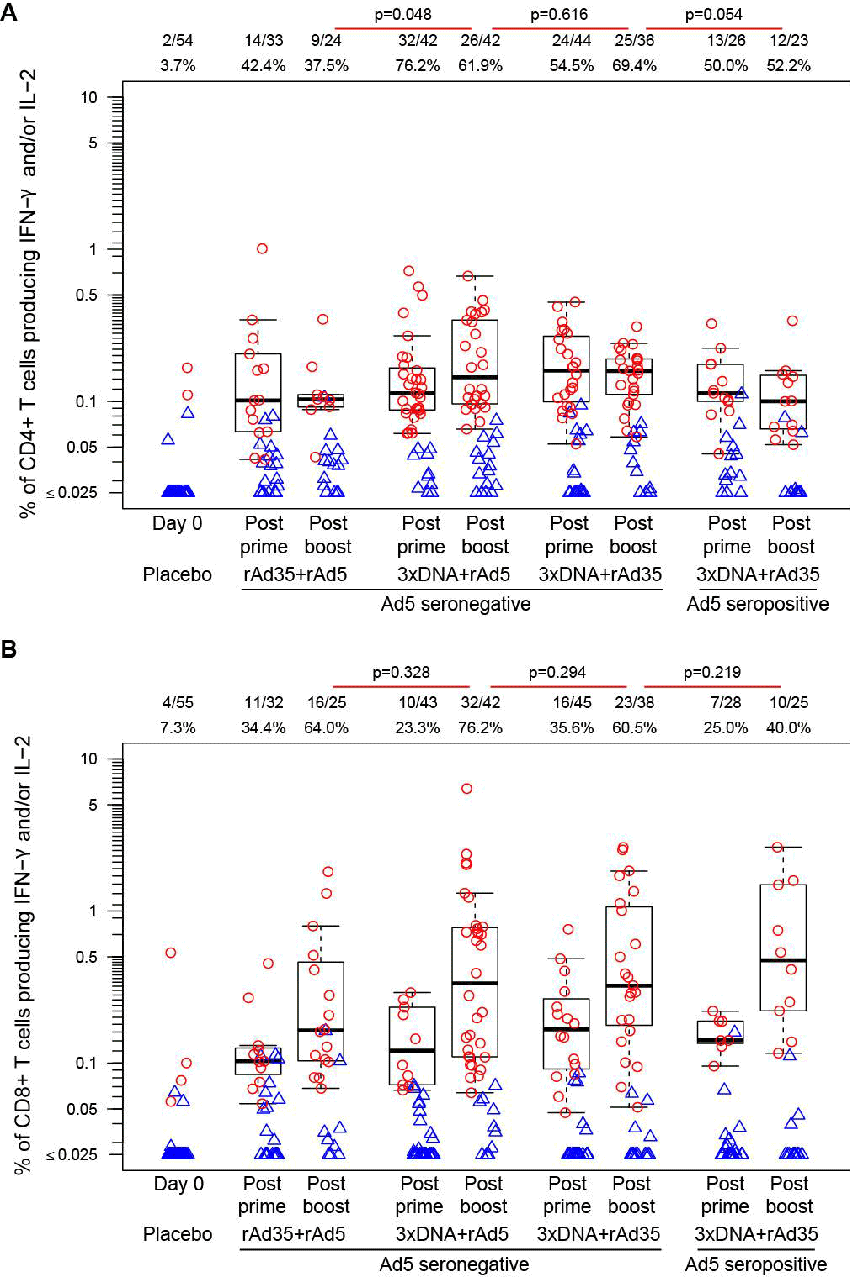
| Figure 4: HIV-specific CD4+ and CD8+ T-cell responses: The percentage of CD4+ (panel A) and CD8+ (panel B) T cells producing γ-interferon (IFN- γ) and/or interleukin-2 (IL-2) in response to EnvA matched peptide pools 4 weeks after the priming immunization(s) and 4 weeks after the boost as measured by intracellular cytokine staining. Responders are shown in red circles and non-responders in blue triangles. Boxplots show the distribution of the magnitude of response in positive responders only. The box indicates the median and interquartile range (IQR); whiskers extend to the furthest point within 1.5 times the IQR from the upper or lower quartile. Numbers at the top of each panel show the number of responders / number with an assay result and the percent with positive response. P-values are derived from Lachenbruch’s test comparing rAd5 and rAd35 boosted groups in Ad5 seronegative individuals and the Ad35-boosted group in Ad5 seropositive individuals. Data from samples with high background cytokine secretion was filtered, leading to differences in the number of samples with available data for CD4+ and CD8+ T cells. |