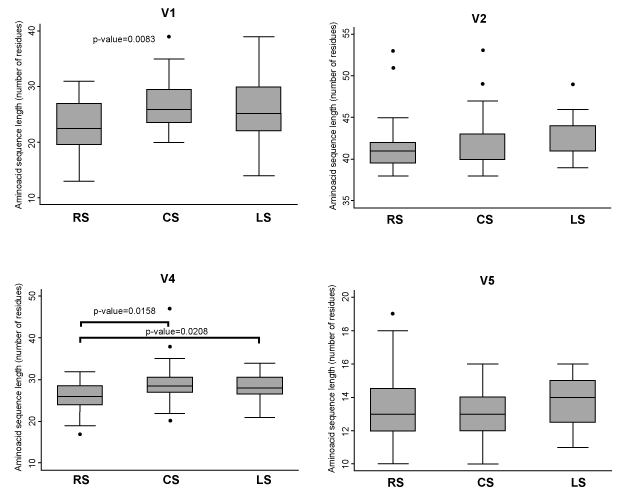
 Significant p values are shown. The box plots denote the median, minimum and maximum values.
RS= Recent disease Stage; CS= Chronic disease Stage; LS= Late disease Stage.
 Significant p values are shown. The box plots denote the median, minimum and maximum values.
RS= Recent disease Stage; CS= Chronic disease Stage; LS= Late disease Stage. |
| Figure 2: Box plot analysis of aminoacid sequence length of V1, V2, V4 and V5 regions from patients at different disease stages. |