 |
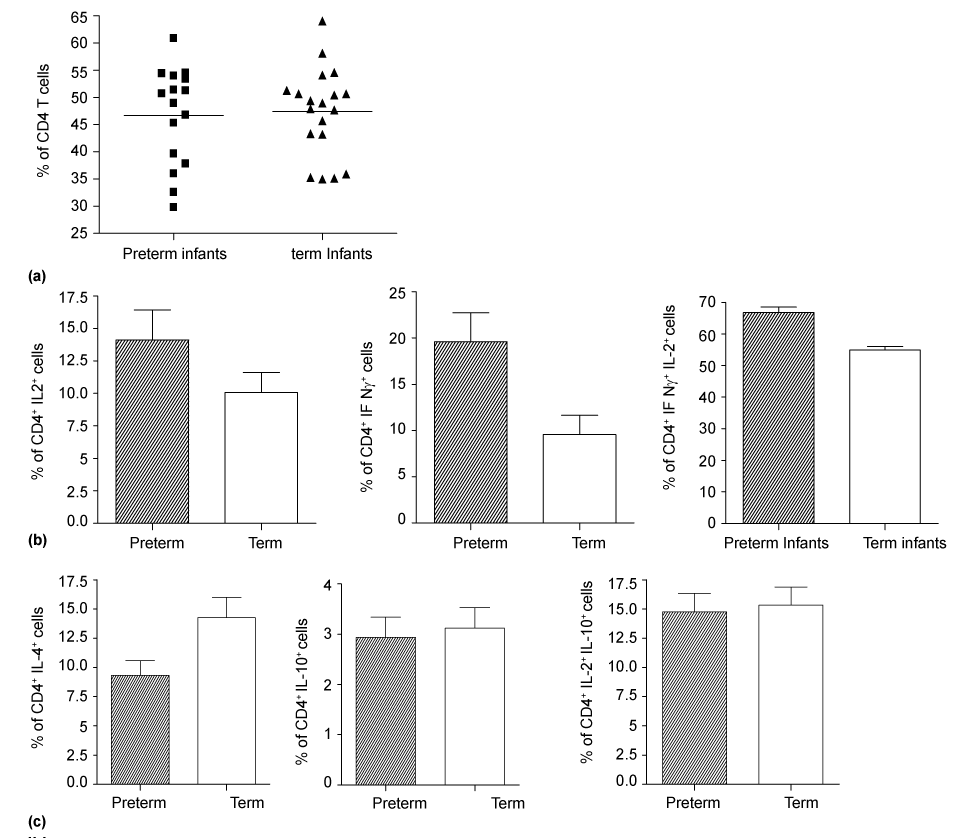
| Figure 2: CD4 T cell functionality: The figure 2a shows the percentage of CD4 T cells in the whole blood. The PBMCs were separated from the whole blood and stimulated with PAMPs and after intracellular staining (ICS), they were evaluated for their ability to produce various cytokines. Figure 2b sows the ability of the CD4 T cells to produce Th-1 cytokines. The left panel shows the percentage of CD4 T cells expressing IL-2 while the middle panel represents the % of CD4 T cells expressing IFN-γ . Polyfunctional Th-1 cytokine producing CD4 T cells are graphically represented in figure 2b, right panel. The Th-2 cytokine response is shown in figure 2c, the left and middle panel represents the IL-4 and IL-10 expressing CD4 T cells while the right panels shows the Th-2 polyfunctional (IL-4 and IL-10) CD4 T cells. |