 |
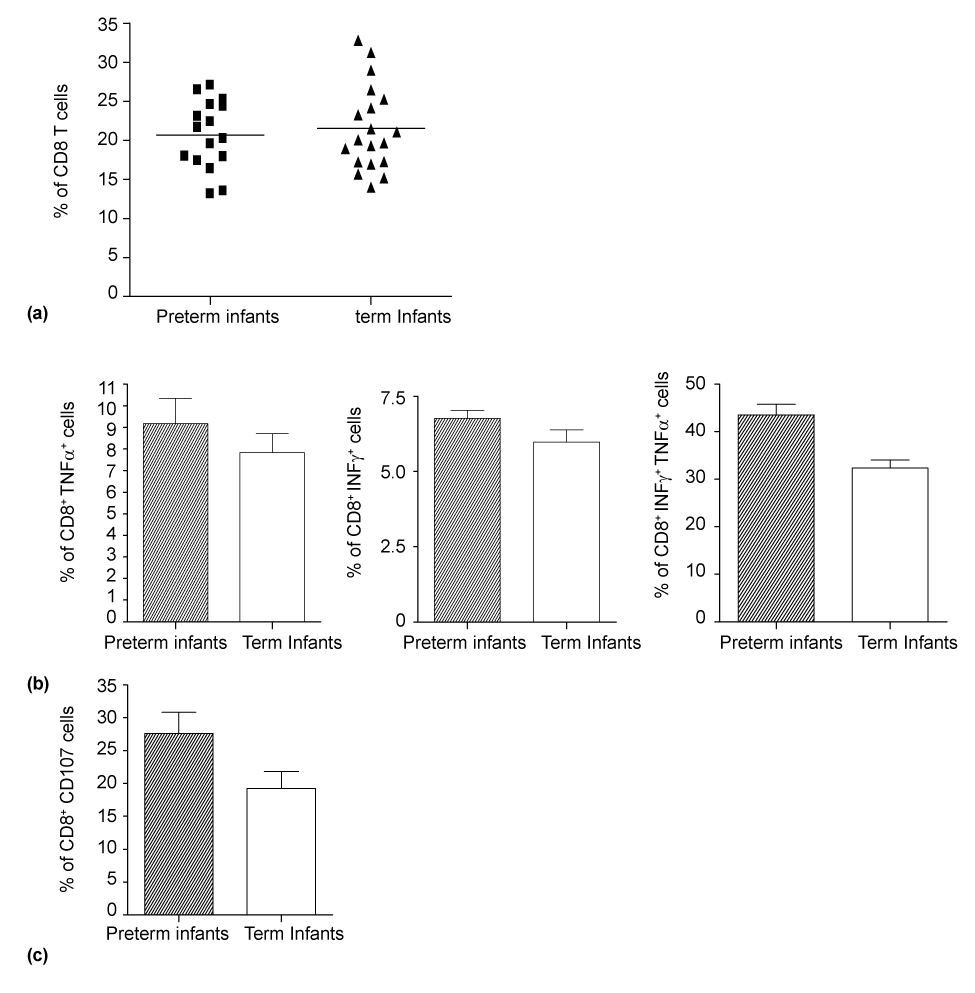
| Figure 3: CD8 T cells response: The total frequency of CD8 T cells is shown in figure 3a while figure 3b and figure 3c represents the cytokine producing ability and cytotoxic ability of CD8 T cells respectively. The left panel of figure 3b shows the % of TNF-α expressing CD8 T cells while the middle panel shows the IFN-γ expressing CD8 T cells. Figure 3c shows the % of CD8 T cells with cytotoxic ability measured in terms of CD107 a/b expression. |