 |
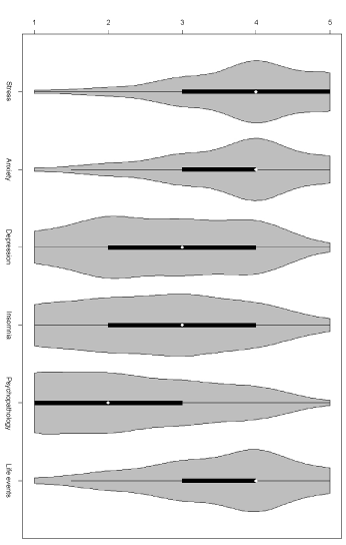
| Figure 1B: Distribution of data per factor: Vertical box plots show density traces. Circles and bold lines represent medians and interquantile ranges, respectively. Responses for Depression, Insomnia, and Psychopathology follow near-normal distributions whereas results for the higher-impact values associated with Stress, Anxiety, and Life-changing Events indicate an endorsement of the involvement of these psychosocial parameters in the origination and development of CSU. |