* Significant difference comparing corresponding data between FA and SS animals, P ≤ 0.05.
 |
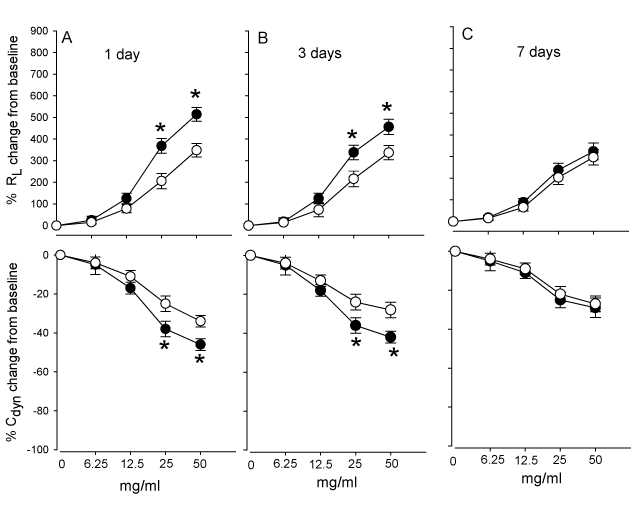
| Figure 1: MCh dose responses of RL and Cdyn at 1 day (A), 3 days (B) and 7
days (C) after either 10 days SS or FA exposure during early postnatal periods.
Data are means ± SE of 6 mice in each group. * Significant difference comparing corresponding data between FA and SS animals, P ≤ 0.05. |