 |
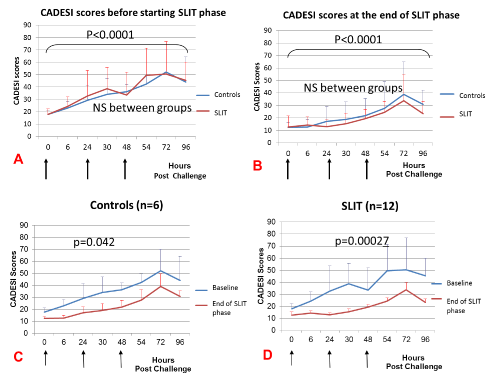
| Figure 5: Total CADESI (Canine Atopic dermatitis Extent and Severity Index Score) scores and standard deviation of SLIT and control groups in the course of allergen challenge before the beginning of SLIT phase (5A) and after 12 months of SLIT (5B). The arrows indicate the time points of application of allergens. Clinical scores were not significantly different between the two groups (NS, no significant effect of group on ANOVA) at month 0 or baseline (5A) and at month 12 at the end of SLIT phase (5B). When the comparison was done within each group before and after SLIT, a statistically significant decrease was found both in the control (p=0.042, 5C) and in the SLIT group (p=0.00027, 5D). |